
Medicine (Baltimore). 2015;94(41):e1666.
Comparison of Endoscopic Ultrasonography, Computed Tomography, and Magnetic Resonance Imaging for Pancreas Cystic Lesions.
제1저자 이윤석 · 교신저자 황진혁
소속 (1)
- From the Department of Internal Medicine, Seoul National University College of Medicine, Seoul National University Bundang Hospital, Gyeonggi-do (YSL, K-HP, HWK, J-CL, JK, J-HH); and Department of Internal Medicine, Keimyung University School of Medicine, Daegu, Republic of Korea (YSL).
Abstract
Consensus regarding which modality is optimal for the measurement of pancreas cystic lesions (PCLs) was not achieved although cyst size is important for clinical decisions. This study aimed to evaluate the properties of endoscopic ultrasonography (EUS) compared with computed tomography (CT) and magnetic resonance imaging (MRI) in measuring the size of PCL.A total of 34 patients who underwent all 3 imaging modalities within 3 months before surgery were evaluated retrospectively. The size measured by each modality was compared with the pathologic size as a reference standard using Bland-Altman analysis and intraclass correlation coefficients (ICCs).The mean size difference was 1.76 mm (ICC 0.86), 7.35 mm (ICC 0.95), and 8.65 mm (ICC 0.93) in EUS, CT, and MRI. EUS had the widest range of 95% limits of agreement (LOA) (-17.54 to +21.07), compared with CT (-6.21 to +20.91), and MRI (-6.82 to +24.12). The size by EUS tended to be read smaller in tail portion, while those by CT and MRI did not. When the size was more than 4 cm, the size on EUS was estimated to be smaller than on pathology (r = 0.492; P = 0.003).Although 3 modalities showed very good reliability for the size measurement on PCL compared with corresponding pathologic size, EUS had the lowest level of agreement, while CT showed the highest level among the 3 modalities. Therefore, the size estimated by EUS has to be interpreted with caution, especially when it is located in tail and relevantly large.
Figures
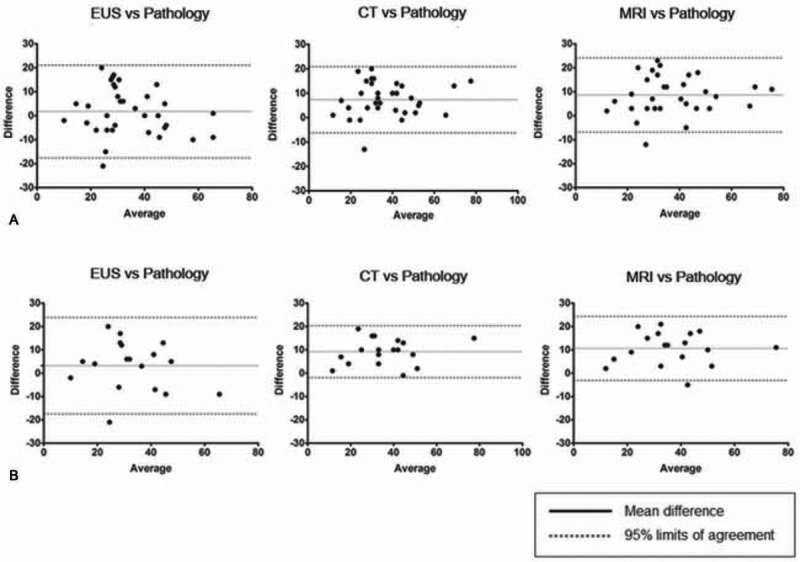
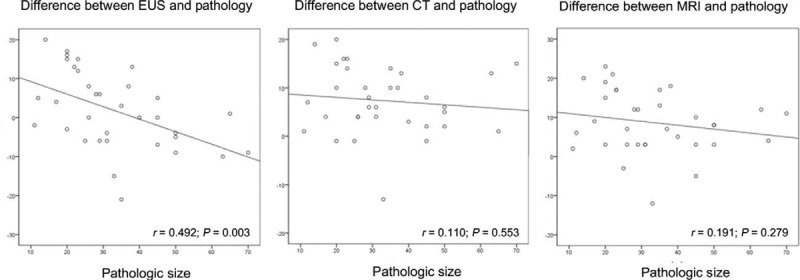
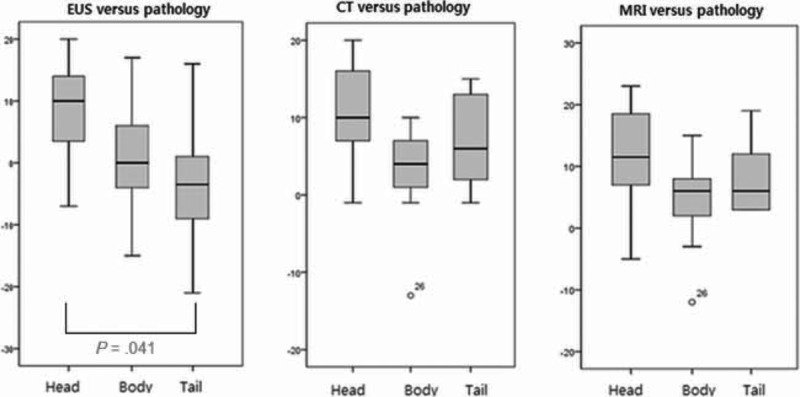
그림 출처: PubMed Central 공개 논문 (PMC4616797)
Conflict of interest statement
The authors have no conflicts of interest to disclose.
그 밖의 정보
- 출판 형태
- Journal Article, Research Support, Non-U.S. Gov't
- 저널
- Medicine · eISSN 1536-5964
- MeSH
- Adult · Aged · Diagnostic Imaging / methods / standards · Endosonography · Female · Humans · Magnetic Resonance Imaging · Male · Middle Aged · Pancreatic Cyst / diagnostic imaging / pathology · Reproducibility of Results · Retrospective Studies · Tomography, X-Ray Computed
- 참고문헌
- 27편