From the Department of Internal Medicine, Ilsan Paik Hospital, Inje University College of Medicine, Goyang (SWO, KHH, SYH); Department of Internal Medicine, Seoul Paik Hospital, Inje University College of Medicine (HSK); The Research Institute of Salt and Health, Seoul (HSK, SK, HJC); Department of Internal Medicine, Seoul National University Bundang Hospital, Seongnam (HJC); and Department of Internal Medicine, Seoul National University College of Medicine, Seoul, Korea (HJC).
Abstract
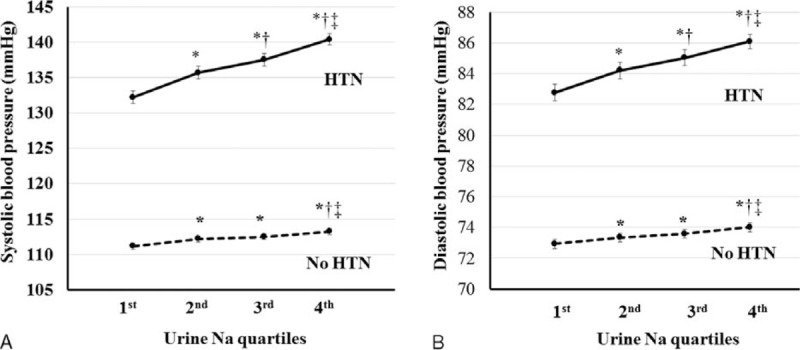
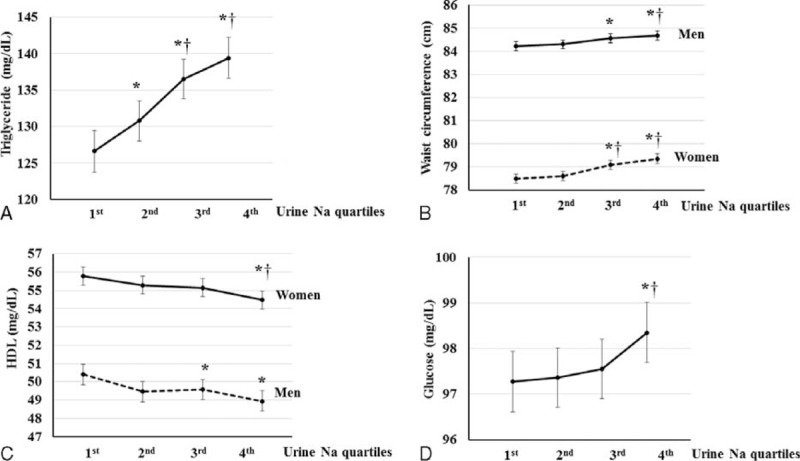
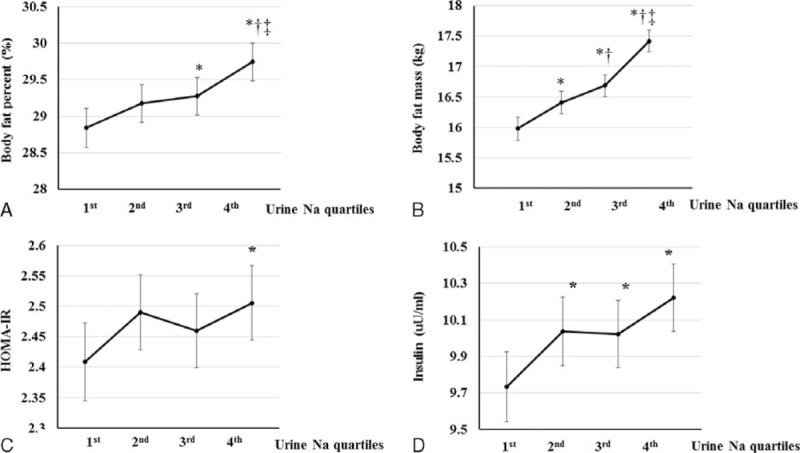
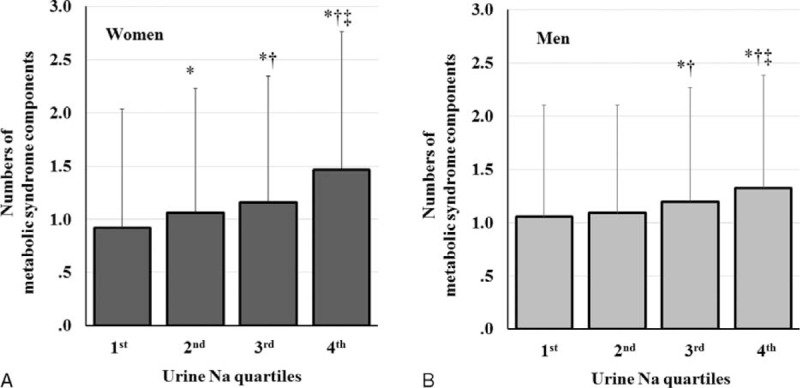
Sodium intake was reported to be related to metabolic syndrome (MS). Although a strong association between sodium intake and blood pressure (BP) has been reported, the relationship between sodium intake and other components of MS is unknown. An observational study of 18,146 adults in the Korea National Health and Nutrition Examination Survey IV-V databases (2008-2011) was performed. Estimates of 24-h sodium excretion were made from a single fasting urine sample. A significant positive association was found between sodium excretion and systolic BP and between sodium excretion and diastolic BP in participants with and without hypertension after adjusting for multiple covariates (P < 0.001 for trend). The relationship between triglyceride or glucose levels and sodium excretion was linear (P < 0.005). In both men and women, a positive relationship between sodium excretion and waist circumference and an inverse relationship between sodium excretion and high-density lipoprotein were found (P ≤ 0.001). Body fat percentage, body fat mass, and insulin level were positively related to sodium excretion (P ≤ 0.001), and HOMA-IR was significantly associated with sodium excretion (P < 0.05). The risk of MS was elevated 1.279-fold in the second quartile of sodium excretion (95% CI, 1.088-1.504, P = 0.003), 1.479-fold in the third quartile (95% CI, 1.262-1.734; P < 0.001), and 1.929-fold in the highest quartile (95% CI 1.654-2.249, P < .001) compared with the lowest quartile. Sodium intake is significantly associated with all components of MS, body fat, and insulin resistance. Therefore, a high-salt diet is a significant risk factor for MS.
Figures
FIGURE 1Relationship between blood pressures and sodium excretion. A, Mean SBP according to sodium excretion levels in participants with or without hypertension. B, Mean DBP according to sodium excretion levels in participants with or without hypertension. SBP, DBP, WC, and TG were adjusted for age, BMI, SBP, WC, calorie intake, hemoglobin, glucose, eGFR, white blood cell (WBC) count, alanine aminotransferase (AST), aspartate aminotransferase (ALT), alkaline phosphatase (ALP), total cholesterol, ferritin, TG, high-density lipoprotein (HDL), 25-OH vitamin D using covariance (ANCOVA) analysis.FIGURE 2Relationship between metabolic syndrome (MS) components and sodium excretion. A, Mean triglyceride (TG) levels according to sodium excretion. B, Mean waist circumference (WC) according to sodium excretion levels in men and women. SBP, DBP, WC, and TG were adjusted for age, BMI, SBP, WC, calorie intake, hemoglobin, glucose, eGFR, white blood cell (WBC) count, alanine aminotransferase (AST), aspartate aminotransferase (ALT), alkaline phosphatase (ALP), total cholesterol, ferritin, TG, high-density lipoprotein (HDL), 25-OH vitamin D using covariance (ANCOVA) analysis. C, Mean HDL according to sodium excretion in each sex. The HDL was adjusted for age, SBP, calorie intake, hemoglobin, glucose, eGFR, WBC, AST, ALT, ALP, serum total cholesterol, ferritin, and 25-OH vitamin D using ANCOVA analysis. D, Mean glucose level according to sodium excretion. Glucose level was adjusted for age, calorie intake, hemoglobin, eGFR, WBC, AST, ALT, serum total cholesterol, ferritin, and 25-OH vitamin D using ANCOVA analysis. Error bars show the 95% CI. ∗P < 0.05, vs. first quartile, †P < 0.05, vs. second quartile, ‡P < 0.05, vs. third quartile.FIGURE 3Relationship between sodium excretion and both body fat and insulin resistance. A, Mean body fat percentage according to sodium excretion. B, Mean body fat mass according to sodium excretion. Body fat percentage was adjusted for age, systolic blood pressure (SBP), calorie intake, glucose, white blood cell (WBC) count, alanine aminotransferase (AST), aspartate aminotransferase (ALT), alkaline phosphatase (ALP), total cholesterol, ferritin, triglyceride, high-density lipoprotein (HDL), and 25-OH vitamin D using covariance (ANCOVA) analysis. C, Mean HOMA-IR index according to sodium excretion. D, Mean insulin level according to sodium excretion. HOMA-IR and insulin were adjusted for age, SBP, calorie intake, hemoglobin, glucose, estimated glomerular filtration rate, WBC, AST, ALT, ALP, total cholesterol, ferritin, triglyceride, HDL, and 25-OH vitamin D using ANCOVA analysis. Error bars show the 95% CI. ∗P < 0.05, vs. first quartile, †P < 0.05, vs. second quartile, ‡P < 0.05, vs. third quartile.FIGURE 4Number of MS components according to sodium excretion. A, Number of MS components according to sodium excretion in women. B, Number of MS components according to sodium excretion in men. Error bars show the standard deviation of the mean. ∗P < 0.05, vs. first quartile, †P < 0.05, vs. second quartile, ‡P < 0.05, vs. third quartile.
그림 출처: PubMed Central 공개 논문 (PMC4616840)
Conflict of interest statement
The authors have no conflicts of interest to disclose.