Cardiovascular Center & Department of Internal Medicine, Seoul National University Bundang Hospital, Seongnam 13620, Korea.
Molecular Medicine & Biopharmaceutical Sciences, Graduate School of Convergence Science and Technology, Seoul National University, Seoul 03080, Korea.
Innovative Research Institute for Cell Therapy, Seoul National University Hospital, Seoul 03080, Korea.
Molecular Medicine & Biopharmaceutical Sciences, Graduate School of Convergence Science and Technology, Seoul National University, Seoul 03080; Innovative Research Institute for Cell Therapy, Seoul National University Hospital, Seoul 03080, Korea.
Abstract
Pluripotent stem cell (PSC) variations can cause significant differences in the efficiency of cardiac differentiation. This process is unpredictable, as there is not an adequate indicator at the undifferentiated stage of the PSCs. We compared global gene expression profiles of two PSCs showing significant differences in cardiac differentiation potential. We identified 12 up-regulated genes related to heart development, and we found that 4 genes interacted with multiple genes. Among these genes, Gata6 is the only gene that was significantly induced at the early stage of differentiation of PSCs to cardiomyocytes. Gata6 knock-down in PSCs decreased the efficiency of cardiomyocyte production. In addition, we analyzed 6 mESC lines and 3 iPSC lines and confirmed that a positive correlation exists between Gata6 levels and efficiency of differentiation into cardiomyocytes. In conclusion, Gata6 could be utilized as a biomarker to select the best PSC lines to produce PSC-derived cardiomyocytes for therapeutic purposes. [BMB Reports 2018; 51(2): 85-91].
Figures
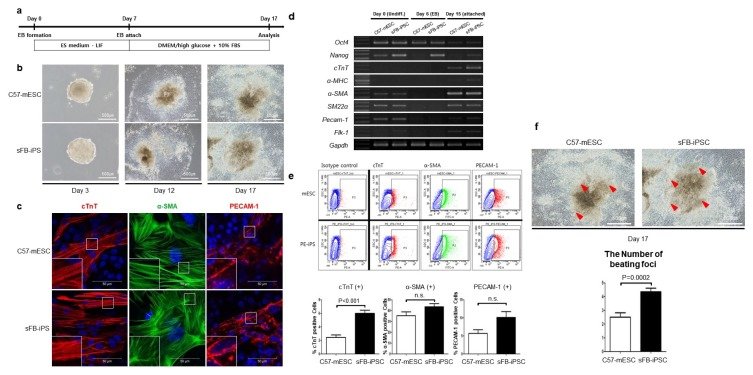
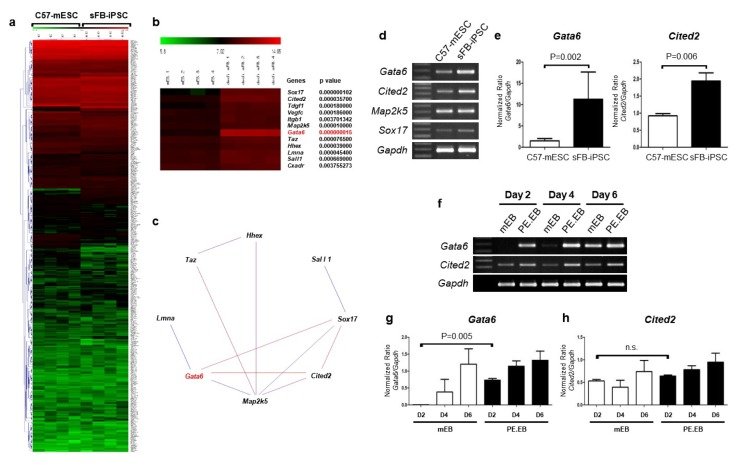
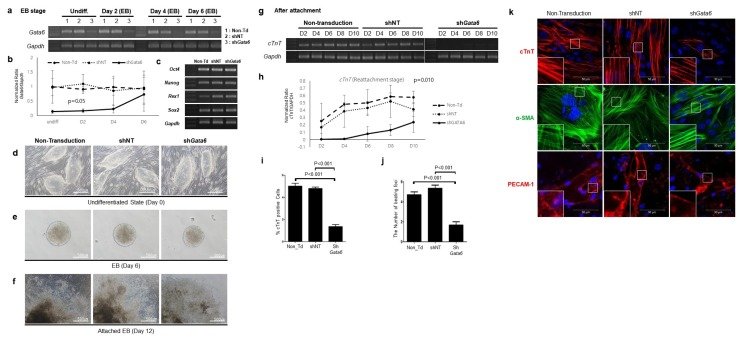
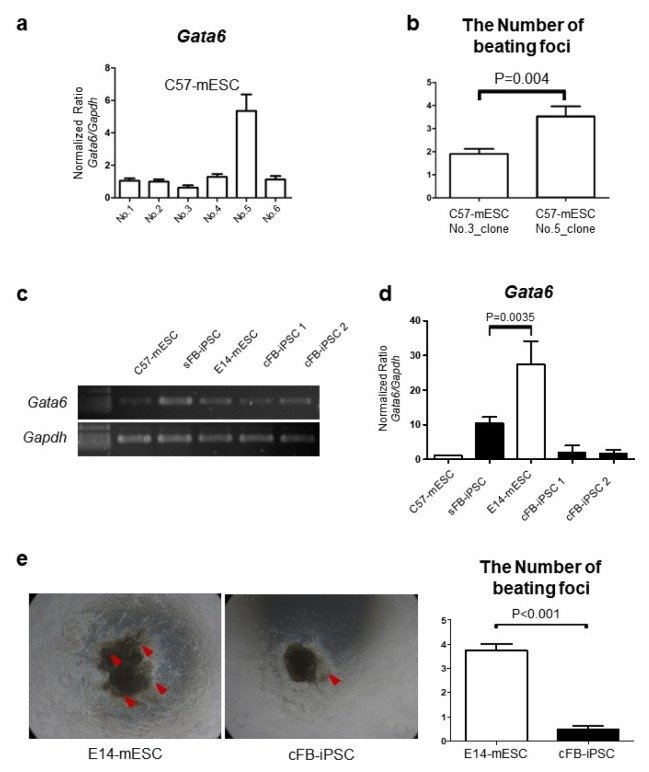
Fig. 1Commitment to cardiac lineage during spontaneous differentiation of mEB was higher in sFB-iPSC than C57-mESC. (A) Schematic diagram of embryoid body (EB)-based differentiation protocol. (B) Representative images of EB at day 3, attached EB at day 12, and emergence of beating foci at day 17. (C) Cardiomyocytes, smooth muscle cells and endothelial cells which differentiated from both pluripotent stem cells; cTnT: cardiac troponin T, α-SMA: alpha smooth muscle actin, PECAM-1: platelet endothelial cell adhesion molecule-1. (D) Gene expression of C57-mESC and sFB-iPSC at an undifferentiated state (day 0), EB (day 6) and attached EB (day 15; 8 days after EB attachment). sFB-iPSC showed higher expression of cTnT. α-MHC: alpha-myosin heavy chain (n = 3 independent experiments, respectively). (E) Representative flow cytometry data comparing cTnT(+), α-SMA(+), and PECAM-1(+) fraction between EB-based spontaneous differentiated C57-mESC and sFB-iPSC (upper panel) and its quantification (lower panel). cTnT(+) cells were more in sFB-iPSC than in C57-mESC (n = 8 independent experiments). (F) Representative image of the attached EB from C57-mESC or sFB-iPSC with the emergence of beating foci at day 17 (left) and its quantification data (right). Red arrowheads denote beating foci that were more frequent in sFB-iPSC than in C57-mESC (n = 22 technical replicates, respectively). Data are represented as mean ± SD.Fig. 2Gene chip analysis of PSC at the undifferentiated status revealed that Gata6 was higher in sFB-iPSC than in C57-mESC. (A) The different expression level of genes that are related to heart development between C57-mESC and sFB-iPSC at the undifferentiated status by hierarchical clustering of microarray data. For the high-resolution figure, see Supplementary Fig. S2. (B) Top 12 genes whose expressions were higher in sFB-iPSC than in C57-mESC during spontaneous differentiation of EB. These genes are sorted by at least 2-fold differences of average expression between C57-mESC and sFB-iPSC. (C) The network diagram of 8 up-regulated genes which have at least one interaction among 12 genes listed above. (D) Gene expression of 4 candidate genes that have at least three interactions among 8 up-regulated genes from Fig. 2C in semi-quantitative RT-PCR. (E) Two genes of Gata6 and Cited2, out of 4 genes from Fig. 3D, whose expressions were higher in sFB-iPSC than in C57-mESC. It is confirmed by quantitative RT (Real Time)-PCR (n = 6 independent experiments). (F-H) The expression level of Gata6 and Cited2 during spontaneous differentiation of EB [C57-mESC-derived EB (mEB) and sFB-iPSC-derived EB (PE.EB)], measured by (F) time-sequential semi-quantitative RT-PCR and (G, H) in time sequential quantitative RT(Real Time)-PCR (n = 2 independent experiments). Data are represented as mean ± SD.Fig. 3Gata6 knock-down blunted cardiac differentiation of sFB-iPSC. (A, B) Time-sequential expression of Gata6 during spontaneous differentiation of EB before attachment in sFB-iPSC (Non-transduction, shNT, and shGata6), using (A) semi-quantitative RT-PCR, (B) quantitative RT(real Time)-PCR. Transduction of shGata6 effectively blocked the expression of Gata6 in sFB-iPSC during spontaneous differentiation. (C) Pluripotent marker genes expression in sFB-iPSC with shGata6 and its control groups at the undifferentiated status. (D-F) Representative morphologies of sFB-iPSC with Gata6 knocked-down using shGata6, comparing with control groups (Non-transduction and shNT) at (D) undifferentiated state Day 0, (E) EB Day 6 and (F) attached EB Day 12. (G, H) Time-sequential expression of cTnT as a cardiac marker in sFB-iPSC during spontaneous differentiation of EB after attachment (Non-transduction, shNT, and shGata6), using (G) semi-quantitative RT-PCR and (H) quantitative RT(Real Time)-PCR. (n = 3 independent experiments for all data in Figure 4, respectively). Spontaneous differentiation to cardiomyocytes was blocked by shGata6 in sFB-iPSC. (I, J) Differentiation to cardiomyocytes was blunted in sFB-iPSC with Gata6 knocked-down. (I) The proportion of troponin T-positive cardiomyocytes measured by flow cytometry (n = 6 independent experiments, respectively) and (J) the beating foci number after spontaneous differentiation of sFB-iPSC with shGata6 and its controls group (n = 43 technical replicates, respectively). (K) Representative immunofluorescent images of the spontaneous differentiation of EB at the attached culture from sFB-iPSC with shGata6 and its control groups; cTnT, α-SMA, PECAM-1 as a cardiomyocyte, smooth muscle cell, and endothelial cell marker, respectively. Data are represented as mean ± SD.Fig. 4Consistent correlation between Gata6 level and the ability to differentiate toward cardiomyocytes among several different PSC lines. (A) Variable Gata6 expression levels among several stable cell lines established from a single colony of C57-mESC, using quantitative RT (Real Time)-PCR (n = 3 independent experiments, respectively). (B) The different efficiency of cardiomyocyte differentiation by comparing the number of beating foci during spontaneous differentiation of C57-mESC stable cell lines between no.3 and no. 5, which showed the most significant difference of Gata6 expression level at undifferentiated state from Fig. 4A (n = 3 independent experiments, respectively). (C, D) Gata6 expression level in various PSC lines including the other mESC and PE-iPSC lines by using (C) semi-quantitative RT-PCR and (D) quantitative RT(Real Time)-PCR (n = 3 independent experiments, respectively). (E) Representative image of beating foci at day 17 from the attached mEB (E14) with the highest Gata6 and PE.EB (Cardiac Fibroblast.1, cFB.1) with the lowest Gata6 (left) and its quantification data (right). Red arrowheads denote beating foci (n = 22 technical replicates, respectively). Data are represented as mean ± SD.
그림 출처: PubMed Central 공개 논문 (PMC5836562)
Conflict of interest statement
CONFLICTS OF INTEREST. The authors have no conflicting interests.