Department of New Biology, Daegu Gyeongbuk Institute of Science and Technology, Daegu, 42988, Republic of Korea.
Department of Chemistry, Research Institute for Natural Sciences, Korea University, Seoul, 136-701, Republic of Korea.
Department of Internal Medicine, Seoul National University College of Medicine, Seoul, 03080, Republic of Korea.
Department of Orthopedic Surgery, Seoul National University Bundang Hospital, Seongnam, Gyeonggi-do, 13620, Republic of Korea.
Department of Microbiology, Catholic University of Daegu School of Medicine, Daegu, 42472, Republic of Korea.
Department of Molecular Medicine and Biopharmaceutical Sciences, Graduate School of Convergence Science and Technology, Seoul National University, Seoul, 03080, Republic of Korea.
Department of Internal Medicine, Seoul National University Bundang Hospital, Seongnam, 13620, Republic of Korea.
Department of New Biology, Daegu Gyeongbuk Institute of Science and Technology, Daegu, 42988, Republic of Korea. dhwang@dgist.ac.kr.
Center for Plant Aging Research, Institute for Basic Science, Daegu, 42988, Republic of Korea. dhwang@dgist.ac.kr.
Department of Chemistry, Research Institute for Natural Sciences, Korea University, Seoul, 136-701, Republic of Korea. sw_lee@korea.ac.kr.
Department of Internal Medicine, Seoul National University College of Medicine, Seoul, 03080, Republic of Korea. kspark@snu.ac.kr.
Department of Molecular Medicine and Biopharmaceutical Sciences, Graduate School of Convergence Science and Technology, Seoul National University, Seoul, 03080, Republic of Korea. kspark@snu.ac.kr.
Abstract
The pathogenesis of type 2 diabetes mellitus (T2DM) is closely associated with mitochondrial functions in insulin-responsive tissues. The mitochondrial proteome, compared with the mitochondrial genome, which only contains 37 genes in humans, can provide more comprehensive information for thousands of mitochondrial proteins regarding T2DM-associated mitochondrial functions. However, T2DM-associated protein signatures in insulin-responsive tissues are still unclear. Here, we performed extensive proteome profiling of mitochondria from skeletal muscles in nine T2DM patients and nine nondiabetic controls. A comparison of the mitochondrial proteomes identified 335 differentially expressed proteins (DEPs) between T2DM and nondiabetic samples. Functional and network analyses of the DEPs showed that mitochondrial metabolic processes were downregulated and mitochondria-associated ER membrane (MAM) processes were upregulated. Of the DEPs, we selected two (NDUFS3 and COX2) for downregulated oxidative phosphorylation and three (CALR, SORT, and RAB1A) for upregulated calcium and protein transport as representative mitochondrial and MAM processes, respectively, and then confirmed their differential expression in independent mouse and human samples. Therefore, we propose that these five proteins be used as a potential protein profile that is indicative of the dysregulation of mitochondrial functions in T2DM, representing downregulated oxidative phosphorylation and upregulated MAM functions.
Figures
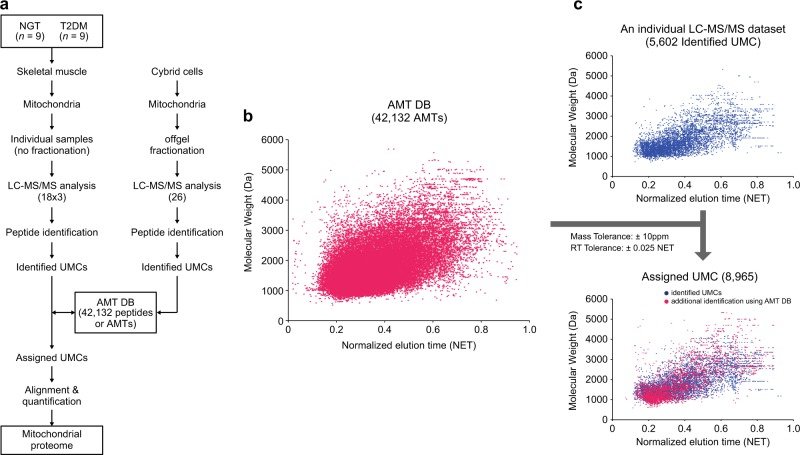
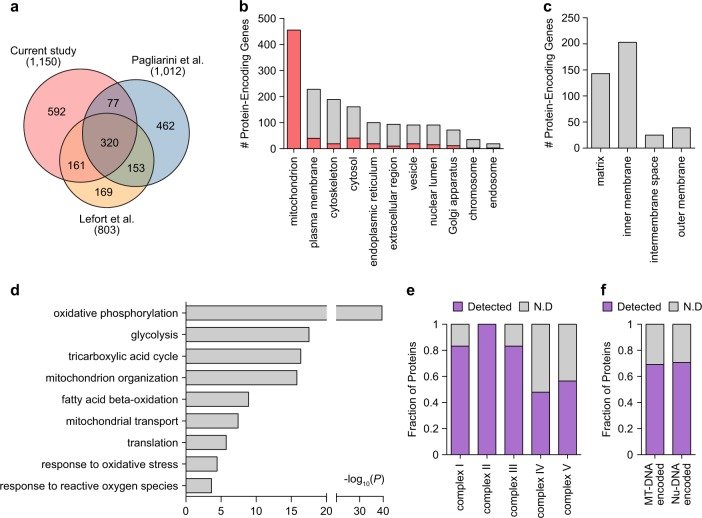
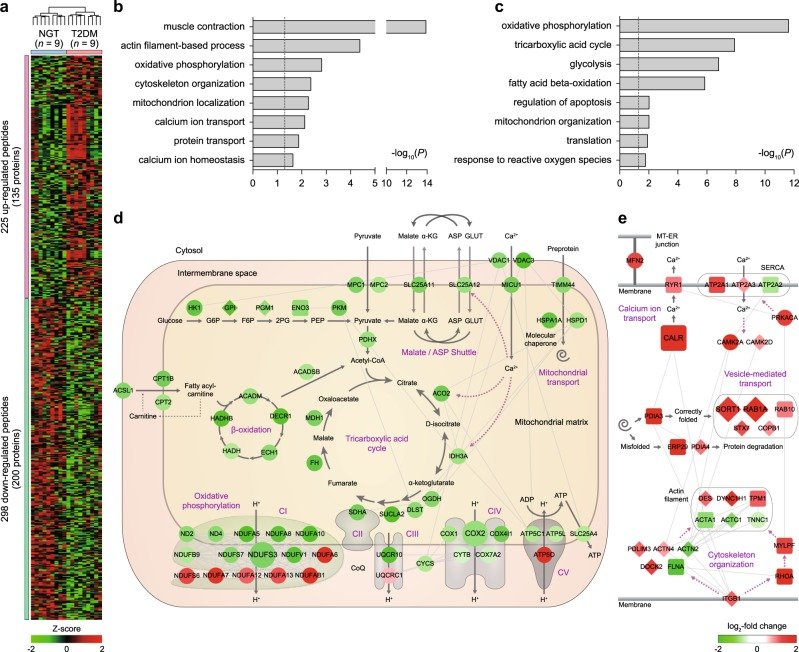
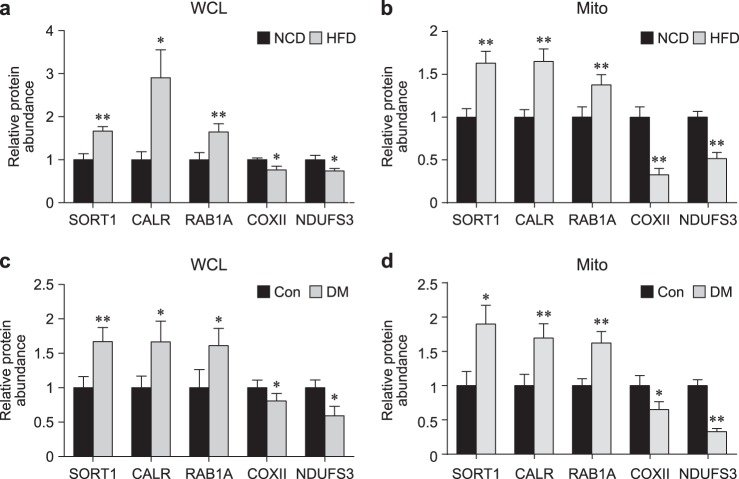
Fig. 1 Master AMT DB of the mitochondrial proteome. a The overall scheme of AMT DB construction. A total of 80 datasets (18 × 3 + 24) were generated from LC-MS/MS analysis. Each dataset was processed by iPE-MMR, after which a target-decoy MS-GF+ search was performed (peptide identification). The resultant peptides (or identified UMCs) were used to construct the AMT DB. b, c Utilization of the AMT DB to assign peptide IDs to unidentified UMCs. The 42,132 AMTs (magenta dots) in the AMT DB are visualized in a 2D (NET and molecular weight) scatter plot (left). For a LC-MS/MS dataset, the identified UMCs (blue dots) are shown in the upper right scatter plot. By matching the unidentified UMCs in this dataset with AMTs using the indicated mass and NET tolerances, a subset of unidentified UMCs was assigned to peptide IDs of matching AMTs. These matched UMCs (red dots) are shown in the bottom right scatter plotFig. 2 Comprehensive profiles of the mitochondrial proteome. a Comparison of our proteome with two previous mitochondrial proteomes. For the proteins detected in individual studies, the numbers of genes encoding the proteins are shown. Venn diagram showing the relationships of our mitochondrial proteome with the largest previous mitochondrial proteomes. b Relative proportions of cellular components (GOCCs) in which the measured mitochondrial proteins are mainly localized. In each stacked bar, the red bar represents the proportion of proteins that can be localized to mitochondria according to GOCCs (e.g., 40 of 228 plasma membranous proteins can be co-localized to mitochondria). c Distribution of the mitochondrial proteins in sub-mitochondrial localization. d Cellular processes (GOBPs) in which the identified proteins are mainly involved. The bars represent–log10(P), where P represents the significance of each GOBP enriched by the mitochondrial proteins. The P-value was computed using DAVID software. e, f Coverage of the mitochondrial proteome in oxidative phosphorylation complexes. In the stacked bars, the purple bars represent the proportions of proteins detected for all of the proteins included in complex I-V (e) and encoded by the nucleus (Nu-DNA) or mitochondria genome (MT-DNA) (f)Fig. 3 Network models delineating cellular processes represented by T2D-associated mitochondrial proteins (DEPs). a Heat maps showing differential expression of 523 peptides with altered abundances between T2DM patients and nondiabetic controls. Colors represent upregulation (red) and downregulation (green) in T2DM compared with nondiabetic controls. The color bar denotes the gradient of the auto-scaled intensities with a mean = 0 and standard deviation = 1. b, c Cellular processes (GOBPs) represented by upregulated (b) and downregulated (c) proteins. The bars represent –log10(P), where P represents the significance of each GOBP enriched by the DEPs. d, e Network models describing the interactions of the DEPs in mitochondria (d) and MAM (e) and their first neighbors involved in the selected GOBPs. The node colors represent upregulation (red) and downregulation (green) in T2DM compared with nondiabetic controls. The color bar denotes the gradient of the log2-fold changes between T2DM and nondiabetic controls. The edges represent protein–protein interactions (gray) collected from four interactome databasesFig. 4 Validation of the selected proteins in independent samples. a-d Protein expression levels of the five selected proteins (SORT1, CARL, RAB1A, COX2, and NDUFS3) in T2DM and nondiabetic samples. SORT1, CARL, and RAB1A were upregulated in high fat diet-fed mice (diabetic conditions) compared with normal chow diet-fed mice (nondiabetic conditions), whereas COX2 and NDUFS3 were downregulated. Total proteins (a; WCL) and mitochondria fractions (b; Mito) were prepared from skeletal muscle tissues of normal chow diet- and high fat diet-fed mice (n = 11). Furthermore, total proteins (c; WCL) and mitochondria fractions (d; Mito) were prepared from human skeletal muscle tissues of T2DM patients (n = 14) and nondiabetic controls (n = 12). The data are shown as the mean ± SEM. *P < 0.05, **P < 0.01 by the Mann–Whitney test
그림 출처: PubMed Central 공개 논문 (PMC6162255)
Conflict of interest statement
The authors declare that they have no conflict of interest.
그 밖의 정보
출판 형태
Journal Article, Research Support, Non-U.S. Gov't
저널
Experimental & molecular medicine · eISSN 2092-6413