
PLoS One. 2010;5(11):e13858.
Changes in hepatic gene expression upon oral administration of taurine-conjugated ursodeoxycholic acid in ob/ob mice.
제1저자 양재성 · 교신저자 조영민
소속 (1)
- School of Interdisciplinary Bioscience and Bioengineering, Pohang University of Science and Technology, Pohang, South Korea.
Abstract
Nonalcoholic fatty liver disease (NAFLD) is highly prevalent and associated with considerable morbidities. Unfortunately, there is no currently available drug established to treat NAFLD. It was recently reported that intraperitoneal administration of taurine-conjugated ursodeoxycholic acid (TUDCA) improved hepatic steatosis in ob/ob mice. We hereby examined the effect of oral TUDCA treatment on hepatic steatosis and associated changes in hepatic gene expression in ob/ob mice. We administered TUDCA to ob/ob mice at a dose of 500 mg/kg twice a day by gastric gavage for 3 weeks. Body weight, glucose homeostasis, endoplasmic reticulum (ER) stress, and hepatic gene expression were examined in comparison with control ob/ob mice and normal littermate C57BL/6J mice. Compared to the control ob/ob mice, TUDCA treated ob/ob mice revealed markedly reduced liver fat stained by oil red O (44.2±5.8% vs. 21.1±10.4%, P<0.05), whereas there was no difference in body weight, oral glucose tolerance, insulin sensitivity, and ER stress. Microarray analysis of hepatic gene expression demonstrated that oral TUDCA treatment mainly decreased the expression of genes involved in de novo lipogenesis among the components of lipid homeostasis. At pathway levels, oral TUDCA altered the genes regulating amino acid, carbohydrate, and drug metabolism in addition to lipid metabolism. In summary, oral TUDCA treatment decreased hepatic steatosis in ob/ob mice by cooperative regulation of multiple metabolic pathways, particularly by reducing the expression of genes known to regulate de novo lipogenesis.
Figures
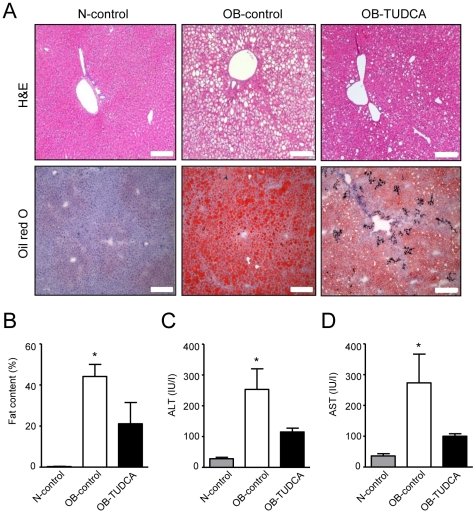
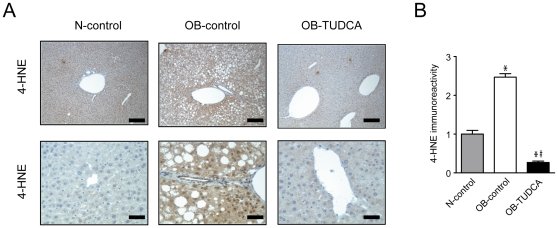
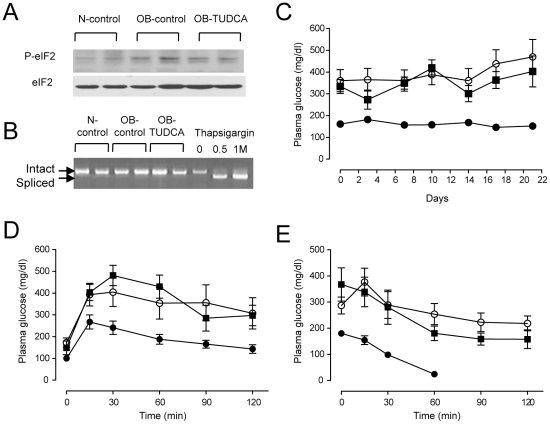
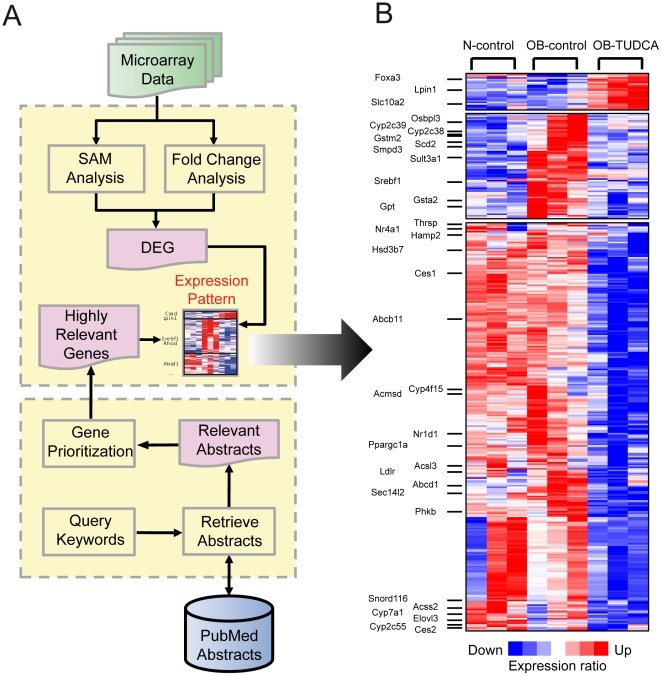
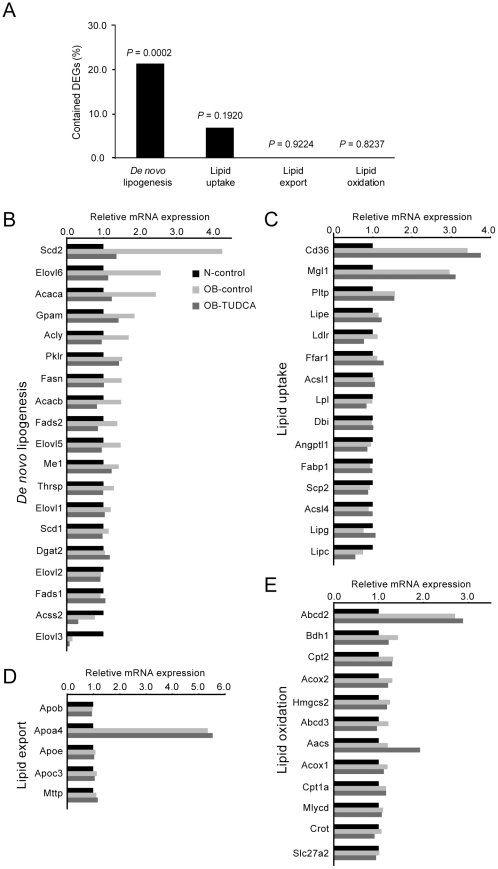
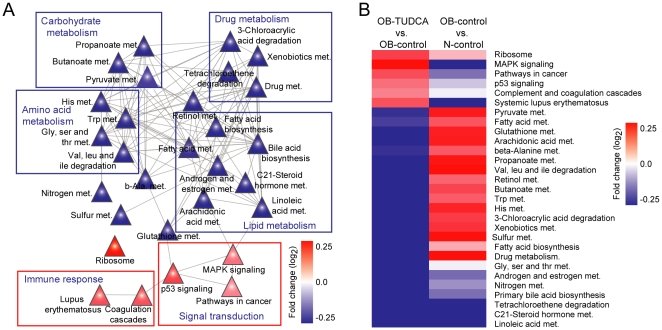
그림 출처: PubMed Central 공개 논문 (PMC2974643)
Conflict of interest statement
Competing Interests:Y.M.C. received a research grant from Daewoong Co. LTD., Seoul, South Korea. Daewoong Co. LTD. is producing and marketing ursodeoxycholic acid. The authors confirm that this does not alter their adherence to all the PLoS ONE policies on sharing data and materials.
그 밖의 정보
- 출판 형태
- Journal Article, Research Support, Non-U.S. Gov't
- 저널
- PloS one · eISSN 1932-6203
- 전자 출판
- 2010-11-05
- MeSH
- Administration, Oral · Amino Acids / metabolism · Animals · Blotting, Western · Carbohydrate Metabolism / drug effects · Cluster Analysis · Endoplasmic Reticulum / drug effects / metabolism · Fatty Liver / complications / drug therapy / genetics · Gene Expression Profiling · Gene Expression Regulation / drug effects · Glucose / metabolism · Homeostasis / drug effects · Lipid Peroxidation / drug effects · Liver / drug effects / metabolism / pathology · Male · Mice · Mice, Inbred C57BL · Mice, Obese · Obesity / complications / genetics · Oligonucleotide Array Sequence Analysis · Reverse Transcriptase Polymerase Chain Reaction · Taurine / administration & dosage / pharmacology · Ursodeoxycholic Acid / administration & dosage / pharmacology
- Substances
- Amino Acids · taurine-ursodeoxycholate conjugate · Taurine · Ursodeoxycholic Acid · Glucose
- 참고문헌
- 49편