Korean Cell Line Bank, Laboratory of Cell Biology, Cancer Research Institute, Seoul National University College of Medicine, 101, Daehak-ro, Jongno-gu, Seoul, 03080, Korea.
Ischemic/Hypoxic Disease Institute, Seoul National University College of Medicine, Seoul, Korea.
Department of Biomedical Sciences, Seoul National University College of Medicine, Seoul, Korea.
Department of Internal Medicine and Liver Research Institute, Seoul National University Hospital, Seoul National University College of Medicine, 103 Daehak-ro, Jongno-gu, Seoul, 03080, Korea. gidoctor@snu.ac.kr.
Department of Surgery, Seoul National University College of Medicine, 103, Daehak-ro, Jongno-gu, Seoul, 03080, South Korea. jangjy4@snu.ac.kr.
Korean Cell Line Bank, Laboratory of Cell Biology, Cancer Research Institute, Seoul National University College of Medicine, 101, Daehak-ro, Jongno-gu, Seoul, 03080, Korea. kujalok@snu.ac.kr.
Ischemic/Hypoxic Disease Institute, Seoul National University College of Medicine, Seoul, Korea. kujalok@snu.ac.kr.
Department of Biomedical Sciences, Seoul National University College of Medicine, Seoul, Korea. kujalok@snu.ac.kr.
Abstract
PURPOSE Early dissemination of primary pancreatic ductal adenocarcinoma (PDAC) is the main cause of dismal prognosis as it highly limits possible treatment options. A number of PDAC patients experience distant metastasis even after treatment due to the metastatic clones. We aimed to demonstrate the molecular architecture of borderline resectable PDAC manifests cancer dissemination of PDAC.
METHODS Here, 36 organoids isolated from primary tumor masses of PDAC patients with diverse metastatic statues are presented. Whole-exome sequencing and RNA sequencing were performed and drug responses to clinically relevant 18 compounds were assessed.
RESULTS Our results revealed that borderline resectable PDAC organoids exhibited distinct patterns according to their metastatic potency highlighted by multiple genetic and transcriptional factors and strong variances in drug responses.
CONCLUSIONS These data suggest that the presence of metastatic PDAC can be identified by integrating molecular compositions and drug responses of borderline resectable PDAC.
BiobankMetastasisOrganoidPancreatic adenocarcinomaPrediction model
Figures
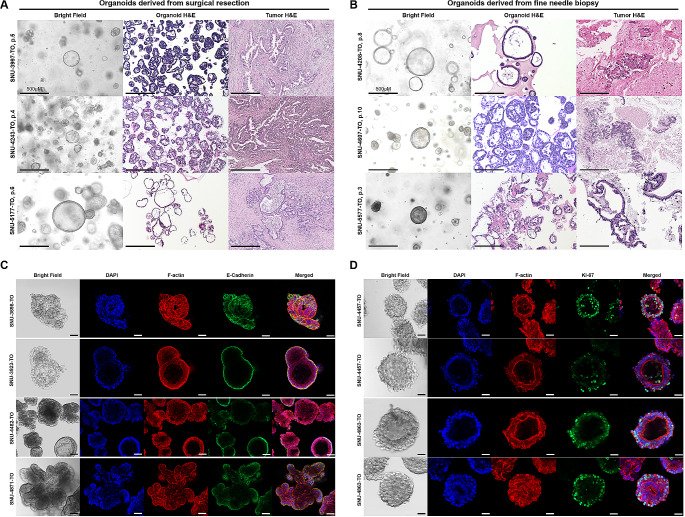
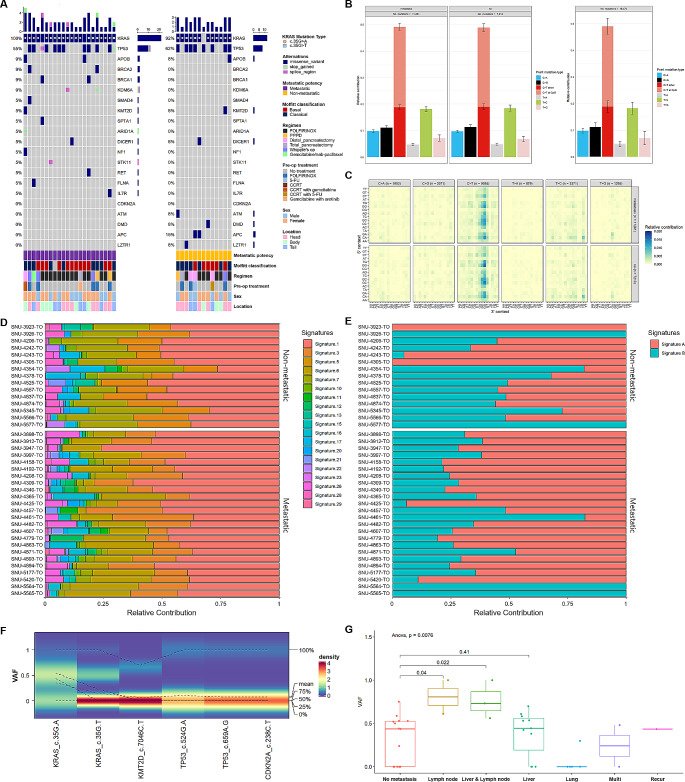
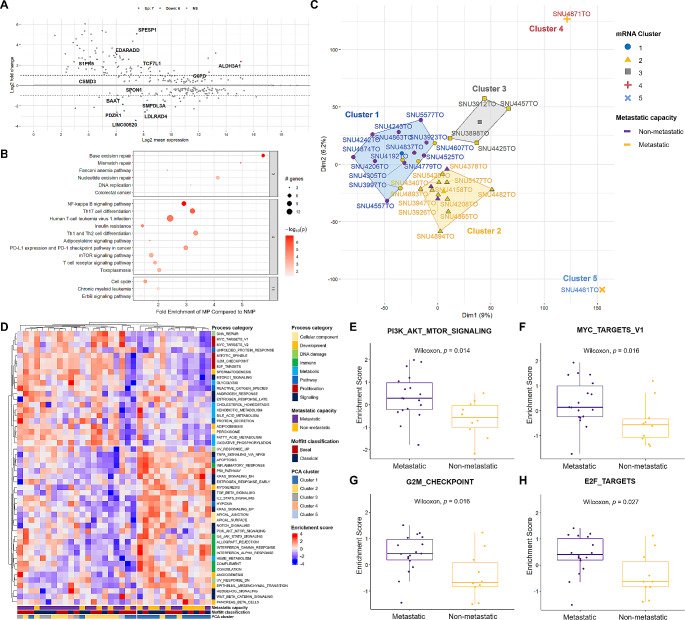
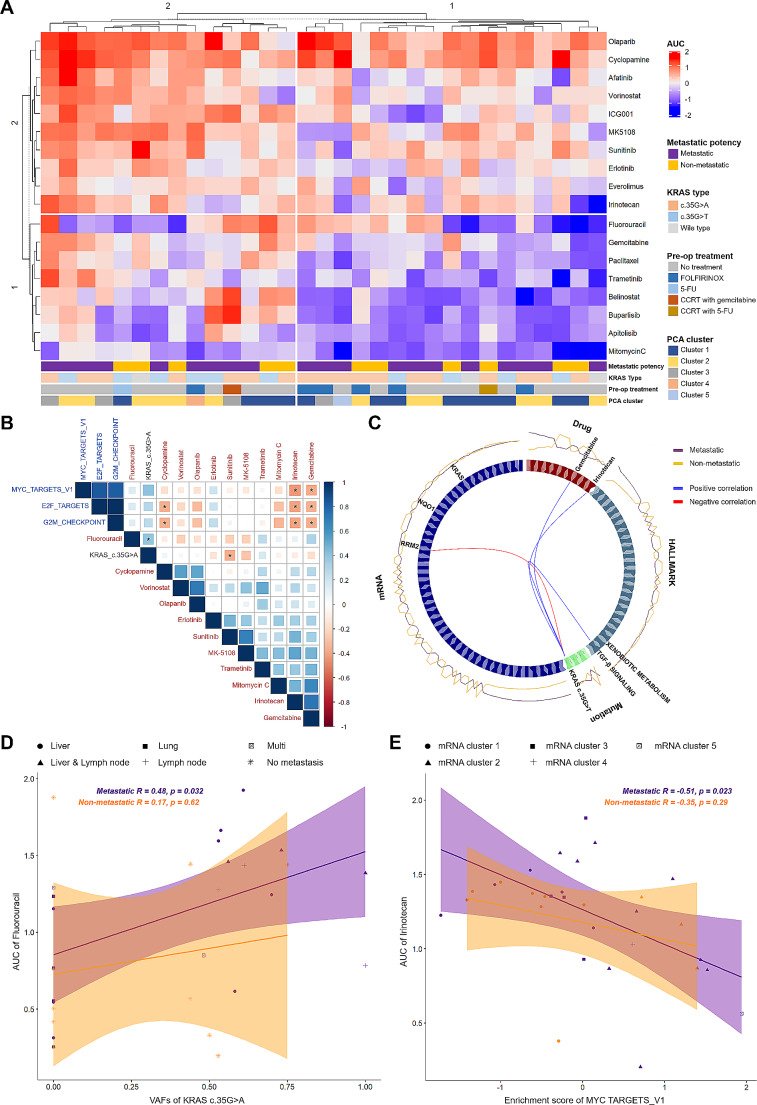
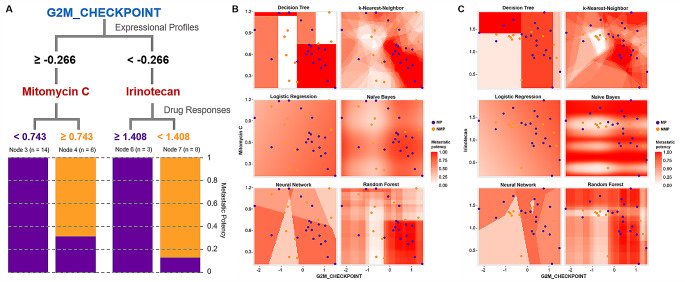
Fig. 1Histopathological Characterization of Pancreatic Ductal Adenocarcinoma Organoids. See also Supplementary Figs. 1, 2. Histological resemblance of PDAC organoids originated from (A) the surgical resection and (B) the fine needle aspiration biopsy. Scale bar = 500 µM. Most organoids showed thin-walled cystic structure with one or more lumen. Tumors devoid of the lumen formed compact organoids. Hematoxylin-eosin (H&E) staining of formalin-fixed paraffin-embedded (FFPE) organoid sections confirmed that most organoids resembled histological structures of the original tumors. Most organoid lines displayed mixed solid, pebble-like morphologies and cystic, balloon-like morphologies. Scale bar = 500 µM (C) Expressional patterns of E-cadherin in accordance with varying metastatic potency. Scale bar = 50 µM (D) Expressional patterns of KI-67 according to heterogeneous morphologies of PDAC organoids. For immunocytochemistry, organoids in their passages 1–3 were used. Scale bar = 50 µMFig. 2Mutational Fraction rather than Mutational Pattern Designates Metastatic Potency. See also Supplementary Figs. 3, 4 and Supplementary Table 3. (A) Representative genes that are mostly mutated in PDAC were compared between organoids groups with metastatic potency (MP, n = 22) and non-metastatic potency (NMP, n = 13). Mutational frequency was calculated in both groups. The number of mutation per each organoid and gene was indicated with bar plots. Each mutation type as well as clinicopathological information are marked with representative colors. The passages of organoids used for whole exome sequencing analysis were p2– p5. (B) Relative contribution of the point mutation types was estimated in both groups. Each mutation type was indicated with representative colors. (C) Relative contribution of the point mutation types was detailed according to the 3’ and 5’ context. The total number of six representative point mutation type was specified. (D) Relative contribution of mutational signatures based on pre-designated repertoire of mutational processes was compared between organoids groups with MP and NMP. Each signature was indicated with representative colors. (E) Relative contribution of two mutational signatures extracted from the point mutation profiles of our PDAC cohort was compared between organoids groups with MP and NMP. Two signatures were specified with representative colors. (F) Density plot presents the variant allele frequencies (VAFs) for five representative point mutations. When VAFs are skewed towards 0, as observed with the KMT2D c.7046 C > T mutation, the density of VAF is high at 0 and is highlighted in red. Conversely, when VAFs are not skewed and are more evenly distributed, as with the KRAS c.35G > A mutation, the density is lower and is highlighted in green. (G) Dispersion of VAF KRAS c.35G > A according to metastasis sites was compared. P value from ANOVA was specified above the bar plot and p values from t-test were designated between compared sitesFig. 3Transcriptomic Sub-Classification Revealed Distinct Pattern of PDACs with Metastatic Potency. See also Supplementary Table 4. (A) Differentially expressed gene (DEG) analysis identified seven up-regulated (Red) and six down-regulated (Blue) genes (p < 0.05). (B) Pathways analysis revealed multiple pathway enrichments of metastatic potential (MP) group compared to non-metastatic (NMP) potential group. The fold enrichment of each pathways was scaled on the x-axis. The size of dots represents the number of counted genes in the dysregulated gene database. The– log transformed p value was indicated by red color. Pathways were clustered according to the number of shared genes with representative pathways on the top. (C) Principle component analysis (PCA) using 27,656 expressional profiles identified three major mRNA clusters separating organoids with MP from NMP. Each mRNA cluster and metastatic potency were marked with representative colors. (D) The single sample gene set enrichment scores (ssGSEA) of each organoid using 50 hallmark gene set database were grouped with k-means (k = 2). Metastatic potency and mRNA cluster from PCA were specified on the x-axis. The process categories, metastatic capacity and mRNA cluster from PCA were designated with representative colors. Enrichment score was indicated with representative colors (Red; up-regulated, Blue; down-regulated). E-H. Wilcoxon rank sum test indicated that four HALLMARK pathways were enriched in organoid groups with metastatic potencyFig. 4Integration of Metastatic Molecular Factors with Heterogeneous Drug Responses Reveals Linear Correlation to Cytotoxic Drugs. See also Supplementary Figs. 6, 7, Supplementary Table 5. (A) Drug responses of PDAC organoids exhibited heterogeneous distribution of 18 compounds. A total of 35 organoids were successfully screened in duplicate, generating > 1,200 measurements of drug interactions. The names of compounds are provided on the right. The organoids and drugs were k-means clustered based on the AUC values across the drug panel. Prospective molecular markers accounting for the metastatic potency were designated under the heatmap to visualize association with heterogeneous drug responses. AUC values ranging from − 2 (Blue; sensitive) to 2 (Red; resistant) and molecular markers were marked with representative colors. (B) The linear correlation of metastatic molecular factors with drug responses is indicated. The name of each factor is designated with different colors (Black; VAFs of KRAS c.35G > A, Blue; enrichment score of hallmarks pathways, Red; compounds). The Pearson correlation coefficient (R) with p-values between the molecular factors and AUC of 11 drugs are represented. (Blue; positive correlation, Red; negative correlation). Significance codes: ‘*’ p < 0.05. (C) Multi-omics analysis interlinked 4 different omics layers (Mutation, mRNA, Hallmark pathway, and drug response) centering on VAFs of KRAS c.35G > T. The correlation between two components is designated with the color of lines (Red, positive correlation; Blue, negative correlation). The correlation coefficient (R) cut-off was 0.77, and relative contribution of each component to organoid groups with MP and NMP is indicated around the circos plot. Each block is marked with representative colors. (D) The linear correlation between the VAFs of KRAS c.35G > A and the AUC of Fluorouracil is depicted. The Pearson correlation coefficient (R) with p value is calculated according to the metastatic potency and marked on the top of the correlation graph. Confidence intervals are calculated at a confidence level of 0.95 for the parameter and indicated by a shading along with the line. The specific metastasis sites were marked with different figures. (E) The linear correlation between the enrichment score of MYC TARGETS_V1 and the AUC of Irinotecan is depicted. The Pearson correlation coefficient (R) with p value is calculated according to the metastatic potency and marked on the top of the correlation graph. Confidence intervals are calculated at a confidence level of 0.95 for the parameter and indicated by a shading along with the line. The specific mRNA clusters were highlighted with different figuresFig. 5Machine Learning Approach Integrates Molecular Factors to Drug Responses to Predict Metastatic Potency. See also Supplementary Table 6. (A) Representative guides from the decision tree method integrate the expression profile with drug responses to estimate metastatic potency. The value of each factor separating MP groups from NMP groups is indicated along the branches of the tree. Each node is divided according to the metastatic potency with the representative colors (Purple; MP, Yellow; NMP). (B) Visualization of correlation between enrichment scores of G2M CHECKPOINT and AUCs of Mitomycin C using six different machine learning methods identified aggregating patterns of MP groups. The metastatic potency ranging from 0 to 1 was highlighted with red color. (C) Visualization of correlation between enrichment scores of G2M CHECKPOINT and AUCs of Irinotecan using six different machine learning methods identified aggregating patterns of MP groups. The metastatic potency ranging from 0 to 1 was highlighted with red color