Graduate School of Medical Science and Engineering, Korea Advanced Institute of Science and Technology (KAIST), Daejeon 34141, Republic of Korea.
Graduate School of Medical Science and Engineering, Korea Advanced Institute of Science and Technology (KAIST), Daejeon 34141, Republic of Korea; Division of Infectious Diseases, Department of Internal Medicine, Korea University Guro Hospital, Korea University College of Medicine, Seoul 08308, Republic of Korea.
Department of Laboratory Medicine, Korea University Guro Hospital, Korea University College of Medicine, Seoul 08308, Republic of Korea.
Division of Infectious Diseases, Department of Internal Medicine, Seoul National University Bundang Hospital, Seoul National University College of Medicine, Seongnam 13620, Republic of Korea.
Division of Infectious Diseases, Department of Internal Medicine, Korea University Guro Hospital, Korea University College of Medicine, Seoul 08308, Republic of Korea.
Division of Infectious Diseases, Department of Internal Medicine, Seoul National University Bundang Hospital, Seoul National University College of Medicine, Seongnam 13620, Republic of Korea. Electronic address: khsongmd@snu.ac.kr.
Division of Infectious Diseases, Department of Internal Medicine, Korea University Guro Hospital, Korea University College of Medicine, Seoul 08308, Republic of Korea. Electronic address: infection@korea.ac.kr.
Graduate School of Medical Science and Engineering, Korea Advanced Institute of Science and Technology (KAIST), Daejeon 34141, Republic of Korea; The Center for Viral Immunology, Korea Virus Research Institute, Institute for Basic Science (IBS), Daejeon 34126, Republic of Korea. Electronic address: ecshin@kaist.ac.kr.
Abstract
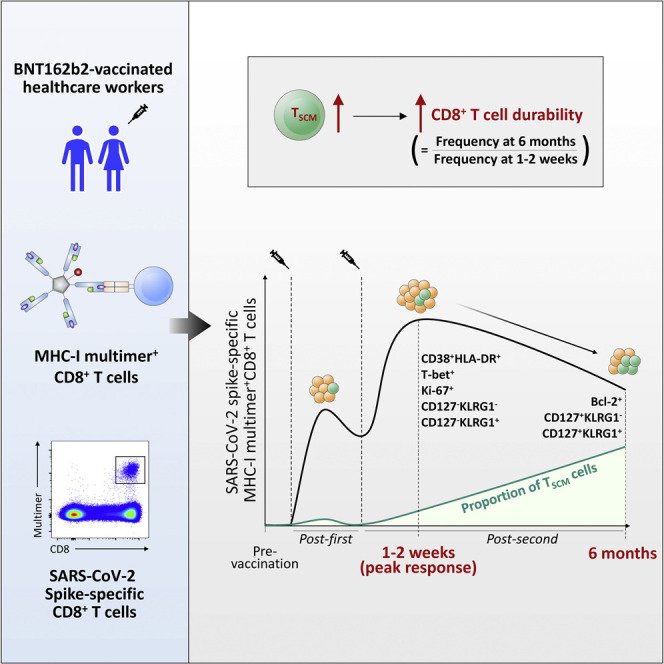
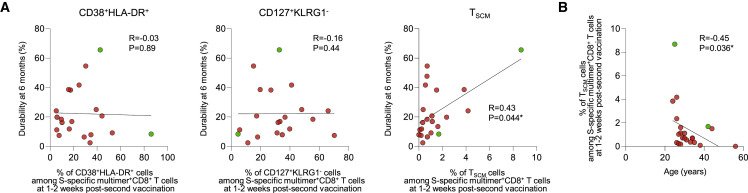
COVID-19 vaccines elicit humoral and cellular immune responses. Durable maintenance of vaccine-induced immunity is required for long-term protection of the host. Here, we examine activation and differentiation of vaccine-induced CD8+ T cells using MHC class I (MHC-I) multimers and correlations between early differentiation and the durability of CD8+ T cell responses among healthcare workers immunized with two doses of BNT162b2. The frequency of MHC-I multimer+ cells is robustly increased by BNT162b2 but decreases 6 months post-second vaccination to 2.4%-65.6% (23.0% on average) of the peak. MHC-I multimer+ cells dominantly exhibit phenotypes of activated effector cells 1-2 weeks post-second vaccination and gradually acquire phenotypes of long-term memory cells, including stem cell-like memory T (TSCM) cells. Importantly, the frequency of TSCM cells 1-2 weeks post-second vaccination significantly correlates with the 6-month durability of CD8+ T cells, indicating that early generation of TSCM cells determines the longevity of vaccine-induced memory CD8+ T cell responses.
CD8(+) T cellCOVID-19CP: ImmunologyMHC class I multimerSARS-CoV-2memory cellvaccine
Figures
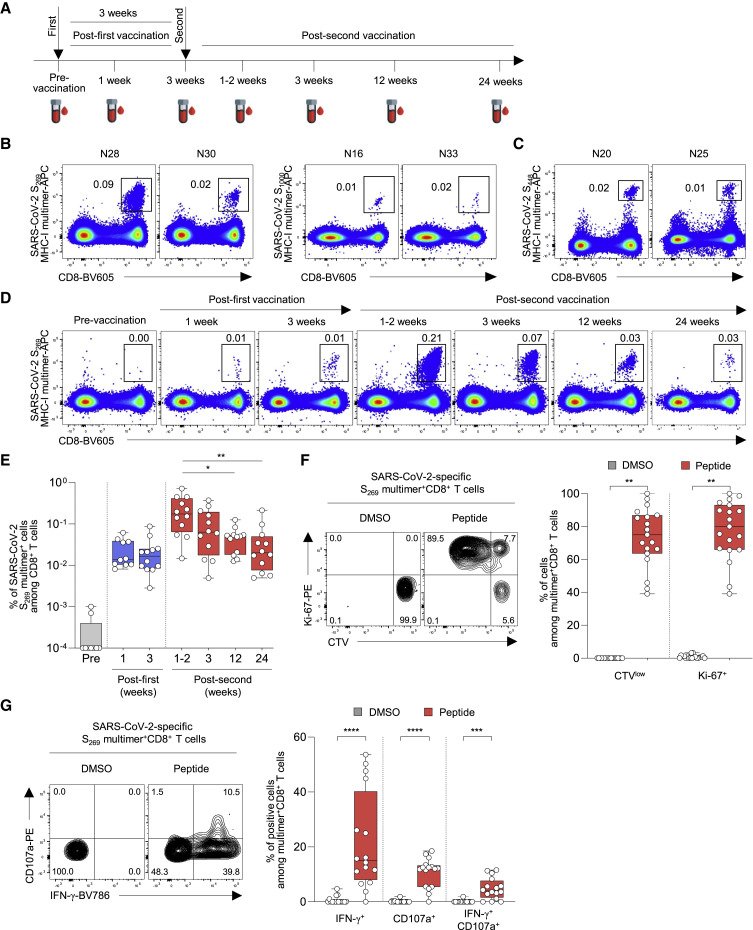
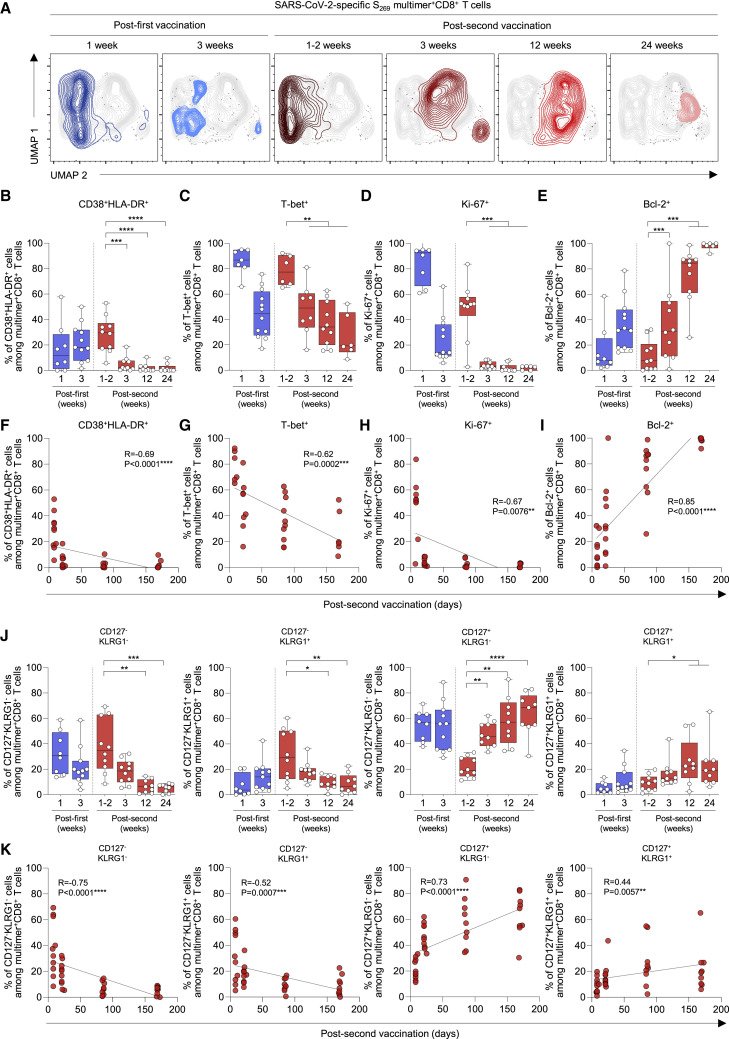
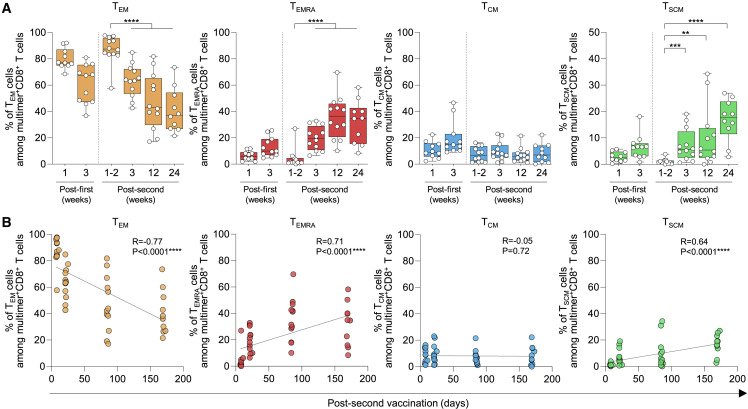
Figure 1The frequency of SARS-CoV-2 S-specific MHC-I multimer+CD8+ T cells in BNT162b2-vaccinated individuals over time PBMCs from BNT162b2-vaccinated individuals were analyzed by flow cytometry. (A) Blood sampling schedule from pre-vaccination to 6 months post-second vaccination. (B and C) Representative flow cytometry plots showing the frequency of (B) SARS-CoV-2 S269 and S1000 MHC-I multimer+CD8+ T cells from HLA-A∗02(+) individuals and (C) SARS-CoV-2 S448 MHC-I multimer+CD8+ T cells from HLA-A∗24(+) individuals in the gate of CD3+ T cells. (D) Representative flow cytometry plots of the frequency of SARS-CoV-2-specific S269 multimer+CD8+ T cells from a single vaccinated individual over time. (E) The frequency of SARS-CoV-2 S269 multimer+CD8+ T cells in vaccinated individuals (n = 12) from pre-vaccination to 24 weeks (6 months) post-second vaccination summarized in a box graph. (F) CTV-labeled PBMCs were stimulated with SARS-CoV-2 S269 epitope (n = 19; samples obtained 6 months post-second vaccination) for 120 h. Left: representative flow cytometry plots showing PBMCs from a vaccinated individual stimulated with DMSO control and peptide. Right: summary box graph showing the frequency of CTVlow and Ki-67+ cells among SARS-CoV-2 S269 multimer+CD8+ T cells. (G) PBMCs were stimulated with SARS-CoV-2 S269 epitope (n = 16; samples obtained 6 months post-second vaccination) for 6 h in the presence of anti-CD107a-PE antibody, and S269 multimer staining and IFN-γ ICS were performed. Left: representative flow cytometry plot showing PBMCs from a vaccinated individual stimulated with DMSO control and S269 peptide. Right: summary box graph showing the frequency of IFN-γ+, CD107a+, and IFN-γ+CD107a+ cells among SARS-CoV-2-specific S269 multimer+CD8+ T cells. Statistical analysis was performed using Kruskal-Wallis test with Dunns’ multiple comparison test (E) or paired Wilcoxon signed rank test (F and G) (∗p < 0.05, ∗∗p < 0.01, ∗∗∗p < 0.001, ∗∗∗∗p < 0.0001). CTV, CellTrace Violet; DMSO, dimethyl sulfoxide. See also Figure S1 and Table S1.Figure 2Phenotypes of SARS-CoV-2 S269 MHC-I multimer+CD8+ T cells in BNT162b2-vaccinated individuals over time (A) UMAP plot of SARS-CoV-2-specific S269 multimer+CD8+ T cells from multiple patients showing the clustering of the multimer+CD8+ T cells over time. Each time point consists of 4–5 patients with a total of 650–750 cells. (B–E and J) The percentages of the indicated subpopulation among SARS-CoV-2-specific S269 multimer+CD8+ T cells in vaccinated individuals over time (B) (n = 11), (C) (n = 8), (D and E) (n = 11), (J) (n = 11) from 1 week post-first vaccination to 24 weeks (6 months) post-second vaccination summarized in box graphs. (F–I and K) Correlation between the percentage of the indicated subpopulation of SARS-CoV-2-specific S269 multimer+CD8+ T cells and days post-second vaccination (F) (n = 11), (G) (n = 8), (H and I) (n = 11), (K) (n = 11) with black lines representing linear regression. Data from boxplot graphs are presented as median and interquartile range (IQR). Statistical analysis was performed using Mann-Whitney U test (B–E and J) or Spearman correlation test (F–I and K) with linear regression analysis (∗p < 0.05, ∗∗p < 0.01, ∗∗∗p < 0.001, ∗∗∗∗p < 0.0001). See also Figures S2 and S3.Figure 3Differentiation kinetics of SARS-CoV-2 S269 MHC-I multimer+CD8+ T cells in BNT162b2-vaccinated individuals (A) The percentages indicate subpopulations among SARS-CoV-2-specific S269 multimer+ memory CD8+ T cells in vaccinated individuals over time summarized in box graphs (n = 12). (B) Correlation between the percentage of the indicated subpopulations of SARS-CoV-2-specific S269 multimer+ memory CD8+ T cells and days post-second vaccination (n = 12) with black lines representing linear regression. Data are presented as median and IQR. Statistical analysis was performed using Mann-Whitney U test (A) or Spearman correlation test with linear regression analysis (B) (∗∗p < 0.01, ∗∗∗p < 0.001, ∗∗∗∗p < 0.0001). See also Figure S4.Figure 4Correlation between the durability of SARS-CoV-2 S-specific MHC-I multimer+CD8+ T cells and TSCM cells (A) Correlation between the durability of S269 (red) and S448 (green) multimer+CD8+ T cells and the percentage of CD38+HLA-DR+ (n = 20), CD127+KLRG1− (n = 20), and TSCM cells (n = 22) among multimer+CD8+ T cells 1–2 weeks post-second vaccination with black lines representing linear regression. Durability was calculated as follows: (the frequency of multimer+ cells among total CD8+ T cells 6 months post-second vaccination/the frequency of multimer+ cells among total CD8+ T cells 1–2 weeks post-second vaccination) × 100. Data are presented as IQRs. (B) Correlation between the percentage of TSCM cells among multimer+CD8+ T cells 1–2 weeks post-second vaccination and the age of the individuals (n = 22) with black lines representing linear regression. Statistical analysis was performed using Spearman correlation test with linear regression analysis (∗p < 0.05). See also Figure S5 and Table S2.
그림 출처: PubMed Central 공개 논문 (PMC9263810)
Conflict of interest statement
Declaration of interests The authors declare no competing interests.