Institute of Allergy and Clinical Immunology, Seoul National University Medical Research Center, Seoul, Korea.
Department of Biomedical Sciences, Laboratory of Immunology and Cancer Biology, Seoul National University College of Medicine, Seoul, Korea.
Department of Internal Medicine, Chung-Ang University College of Medicine, Seoul, Korea.
Department of Biochemistry and Molecular Biology, Seoul National University College of Medicine, Seoul, Korea.
Department of Internal Medicine, Seoul National University College of Medicine, Seoul, Korea.
Abstract
BACKGROUND Transglutaminase 2 (TG2), a multifunctional calcium-dependent acyltransferase, is upregulated in asthmatic airways and reported to play a role in the pathogenesis of allergic asthma. However, the underlying mechanism is not fully understood.
OBJECTIVE To investigate the role of TG2 in alternative activation of alveolar macrophages by using murine asthma model.
METHODS TG2 expression was assessed in induced sputum of 21 asthma patients and 19 healthy controls, and lung tissue of ovalbumin (OVA)-induced murine asthma model. To evaluate the role of TG2 in asthma, we developed an OVA asthma model in both TG2 null and wild-type mice. The expression of M2 macrophage markers was measured by fluorescence-activated cell sorting (FACS) after OVA sensitization and challenge. To evaluate the effect of TG2 inhibition in vitro, interleukin 4 (IL-4) or IL-13-stimulated expression of M2 macrophage markers was measured in CRL-2456 cells in the presence and absence of a TG2 inhibitor.
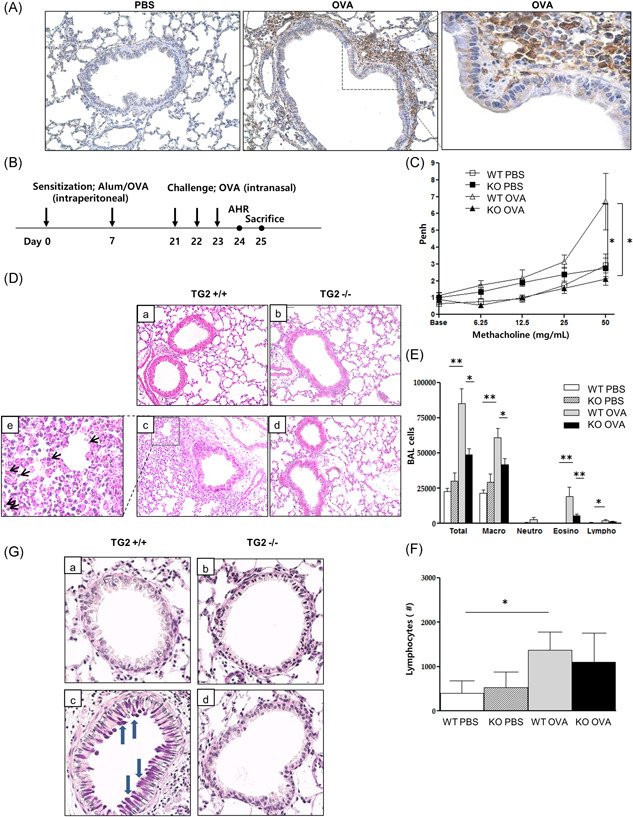
RESULTS The expression of both TG2 and M2 markers was increased in the sputum of asthmatics compared with that of healthy controls. The expression of TG2 was increased in macrophages of OVA mice. Airway hyperresponsiveness, and the number of inflammatory cells, including eosinophils, was significantly reduced in TG2 null mice compared with wild-type mice. Enhanced expression of M2 markers in OVA mice was normalized by TG2 knockout. IL-4 or IL-13-stimulated expression of M2 markers in alveolar macrophages was also attenuated by TG2 inhibitor treatment in vitro.
CONCLUSION Our results suggest that TG2-mediated modulation of alveolar macrophage polarization plays important roles in the pathogenesis of asthma.
Figure 1mRNA expression of TG2 and M2 macrophage markers in human induced sputum samples. The mRNA levels of TG2, CD206, MGL, and ARG1 in induced sputum of asthmatic patients compared with those of healthy controls (A, 21 asthmatics and 19 asymptomatic healthy controls). Fold change values presented in the Y‐axis of each graph. Correlation between sputum CD206 and TG2 expression, between sputum MGL and TG2 expression, and between sputum Arg1 and TG2 expression (B). Correlation coefficients (r) were measured using Pearson's method. MGL, macrophage galactose‐type C‐type lectin 1; TG2, Transglutaminase 2. *p < .05. **p < .01Figure 2TG2 expression and the effect of TG2 on lung inflammation and AHR following allergen challenge. TG2 expression in the lung of a murine asthma model (×400) (A). Experimental protocol of the study (B, n = 5–6 mice per group). Methacholine hyperresponsiveness was measured 24 h after the final intranasal OVA challenge. AHR was expressed as the enhanced pause (Penh) (C). H&E‐stained lung histology after allergen challenge from the mice of the different groups (a: WT PBS, b: KO PBS, c: WT OVA, d: KO OVA, e: black arrows indicate eosinophils, ×200) (D). The number of inflammatory cells, including eosinophils (E) and lymphocytes (F) in BAL fluid. PAS‐stained lung histology after allergen challenge from mice of the different groups (a: WT PBS, b: KO PBS, c: WT OVA, d: KO OVA, blue arrows indicate mucin secretion, ×400) (G). AHR, airway hyperresponsiveness; BAL, bronchoalveolar lavage; H&E, hematoxylin and eosin; KO, knockout; OVA, ovalbumin; PAS, periodic‐acid schiff; PBS, phosphate‐buffered saline; TG2, transglutaminase 2; WT, wild type. *p < .05, **p < .01.Figure 3Effects of TG2 on serum allergen‐specific antibodies, cytokines, and mRNA expression in mouse lung tissue. Serum OVA‐specific IgG1, IgG1/IgG2a ratio, IgE, and IL‐5 in BAL fluid after OVA challenge (A). IL‐4 (upper panel) or IL‐13 (lower panel)‐produced CD4+in CD3+cells were evaluated from pooled lung per group (n = 5–6 mice per group) using flow‐cytometry (B). % indicates the population in CD3+ cells. Real‐time PCR was performed to monitor the changes in mRNA levels in lung tissue. The expression of IFN‐γ, MUC5AC, TGF‐β, and Col4a1 mRNA evaluated after the OVA challenge (C). The levels of mRNA are expressed as a ratio with β‐actin. PLA2 activity and CysLT level were measured in BAL fluid (D). BAL, bronchoalveolar lavage; IL‐4, interleukin‐4; OVA, ovalbumin; CysLT, cysteinyl leukotriene; TG2, transglutaminase 2. *p < .05, **p < .01.Figure 4Effects of TG2 on the expression of M2 macrophage markers in mouse lung tissue and alveolar macrophages. (A–D) The expression of M2 macrophage markers was measured by FACS in TG2 null mice and WT mice after OVA sensitization and challenge (n = 5‐6 mice per group). The proportion of F4/80+ macrophages in CD45+ cells (A), F4/80+ macrophage expressing CD206 (B), Ym‐1 (C), and CD11c+CD206− (M1) (D) are depicted. The mRNA levels of Relm‐α (E), Arg‐1 (F), and CD206 (G) in Th2 cytokine (20 ng/ml)‐stimulated mouse alveolar macrophages were compared according to the TG2 inhibitor treatment (100 μg/ml). Experiments were performed at least three times. The levels of mRNA are expressed as a ratio with β‐actin. Western blot analysis of phospho‐STAT6, total STAT6, and β‐actin expression in Th2 cytokine‐stimulated mouse alveolar macrophages were compared with or without a TG2 inhibitor (H). % Area of phospho‐STAT6 was measured by ImageJ. FACS, fluorescence‐activated cell sorting; OVA, ovalbumin; WT, wild type; STAT, signal transducer and activator of transcription; Tg2, transglutaminase 2. *p < .05, **p < .01
그림 출처: PubMed Central 공개 논문 (PMC8342203)
Conflict of interest statement
The authors declare that there are no conflict of interests.
그 밖의 정보
출판 형태
Journal Article, Research Support, Non-U.S. Gov't
저널
Immunity, inflammation and disease · eISSN 2050-4527