
PLoS One. 2014;9(2):e87958.
Prevalence and outcomes of frailty in Korean elderly population: comparisons of a multidimensional frailty index with two phenotype models.
제1저자 정희원 · 교신저자 김광일
소속 (5)
- Department of Internal Medicine, Seoul National University Bundang Hospital, Seongnam, Republic of Korea ; Seoul National University College of Medicine, Seoul, Republic of Korea.
- Medical Research Collaborating Center, Seoul National University Bundang Hospital, Seongnam, Republic of Korea.
- Department of Rehabilitation, Seoul National University Bundang Hospital, Seongnam, Republic of Korea ; Seoul National University College of Medicine, Seoul, Republic of Korea.
- Department of Neuropsychiatry, Seoul National University Bundang Hospital, Seongnam, Republic of Korea ; Seoul National University College of Medicine, Seoul, Republic of Korea.
- Department of Neuropsychiatry, Seoul National University Bundang Hospital, Seongnam, Republic of Korea ; Seoul National University College of Medicine, Seoul, Republic of Korea ; Department of Brain and Cognitive Science, Seoul National University College of Natural Sciences, Seoul, Republic of Korea.
Abstract
BACKGROUND Frailty is related to adverse outcomes in the elderly. However, current status and clinical significance of frailty have not been evaluated for the Korean elderly population. We aimed to investigate the usefulness of established frailty criteria for community-dwelling Korean elderly. We also tried to develop and validate a new frailty index based on a multidimensional model.
METHODS We studied 693 participants of the Korean Longitudinal Study on Health and Aging (KLoSHA). We developed a new frailty index (KLoSHA Frailty Index, KFI) and compared predictability of it with the established frailty indexes from the Cardiovascular Health Study (CHS) and Study of Osteoporotic Fracture (SOF). Mortality, hospitalization, and functional decline were evaluated.
RESULTS The prevalence of frailty was 9.2% (SOF index), 13.2% (CHS index), and 15.6% (KFI). The criteria from CHS and KFI correlated with each other, but SOF did not correlate with KFI. During the follow-up period (5.6 ± 0.9 years), 97 participants (14.0%) died. Frailty defined by KFI predicted mortality better than CHS index (c-index: 0.713 and 0.596, respectively; p<0.001, better for KFI). In contrast, frailty by SOF index was not related to mortality. The KFI showed better predictability for following functional decline than CHS index (area under the receiver-operating characteristic curve was 0.937 for KFI and 0.704 for CHS index, p = 0.001). However, the SOF index could not predict subsequent functional decline. Frailty by the KFI (OR = 2.13, 95% CI 1.04-4.35) and CHS index (OR = 2.24, 95% CI 1.05-4.76) were associated with hospitalization. In contrast, frailty by the SOF index was not correlated with hospitalization (OR = 1.43, 95% CI 0.68-3.01).
CONCLUSION Prevalence of frailty was higher in Korea compared to previous studies in other countries. A novel frailty index (KFI), which includes domains of comprehensive geriatric assessment, is a valid criterion for the evaluation and prediction of frailty in the Korean elderly population.
Figures

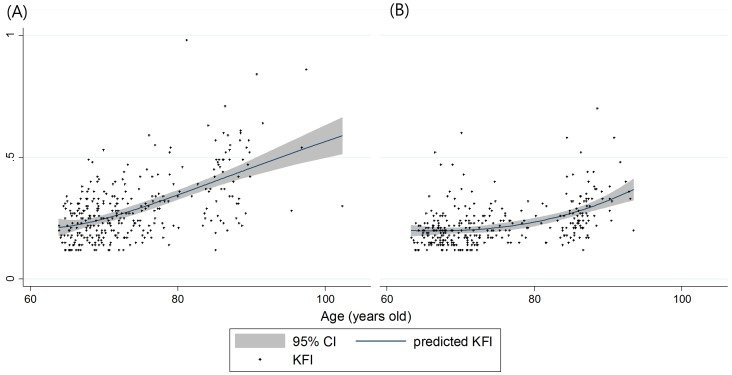

그림 출처: PubMed Central 공개 논문 (PMC3913700)
Conflict of interest statement
Competing Interests:The authors have declared that no competing interests exist.
그 밖의 정보
- 출판 형태
- Journal Article, Research Support, Non-U.S. Gov't
- 저널
- PloS one · eISSN 1932-6203
- 전자 출판
- 2014-02-04
- MeSH
- Aged · Aged, 80 and over · Female · Frail Elderly / statistics & numerical data · Geriatric Assessment / methods / statistics & numerical data · Hospitalization · Humans · Longitudinal Studies · Male · Models, Statistical · Mortality · Outcome Assessment, Health Care · Population Surveillance* · Prevalence · ROC Curve · Republic of Korea · Risk Factors
- 참고문헌
- 21편