Center for Nanoparticle Research, Institute for Basic Science (IBS), Seoul 08826, Republic of Korea.
School of Chemical and Biological Engineering and Institute of Chemical Processes, Seoul National University, Seoul 08826, Republic of Korea.
Institute of Radiation Medicine, Seoul National University Medical Research Center, Seoul 03080, Republic of Korea.
Departments of Cardiology and Internal Medicine, Asan Medical Center, University of Ulsan College of Medicine, Seoul 05505, Republic of Korea.
Division of Cardiology, Department of Internal Medicine, Seoul National University Hospital, Seoul 03080, Republic of Korea.
Department of Physiology, Seoul National University College of Medicine, Seoul 03080, Republic of Korea.
Department of Physiology, Dongguk University College of Medicine, Gyeongju 38066, Republic of Korea.
Department of Internal Medicine, Seoul National University College of Medicine, Seoul 03080, Republic of Korea.
Department of Materials Science and Engineering, Seoul National University, Seoul 08826, Republic of Korea.
Abstract
The implantable cardioverter-defibrillator (ICD) is an effective method to prevent sudden cardiac death in high-risk patients. However, the transvenous lead is incompatible with large-area electrophysiological mapping and cannot accommodate selective multichannel precision stimulations. Moreover, it involves high-energy shocks, resulting in pain, myocardial damage, and recurrences of ventricular tachyarrhythmia (VTA). We present a method for VTA treatment based on subthreshold electrical stimulations using a stretchable epicardial multichannel electrode array, which does not disturb the normal contraction or electrical propagation of the ventricle. In rabbit models with myocardial infarction, the infarction was detected by mapping intracardiac electrograms with the stretchable epicardial multichannel electrode array. Then, VTAs could be terminated by sequential electrical stimuli from the epicardial multichannel electrode array beginning with low-energy subthreshold stimulations. Last, we used these subthreshold stimulations to prevent the occurrence of additional VTAs. The proposed protocol using the stretchable epicardial multichannel electrode array provides opportunities toward the development of innovative methods for painless ICD therapy.
Figures
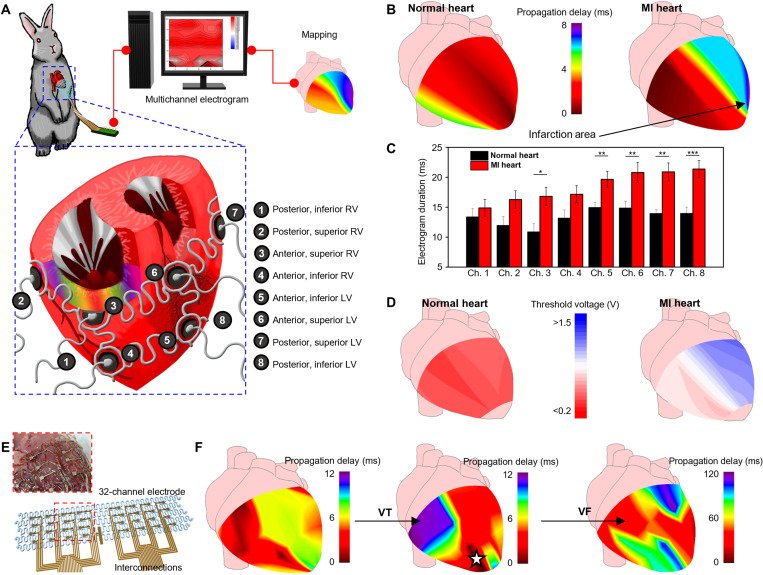
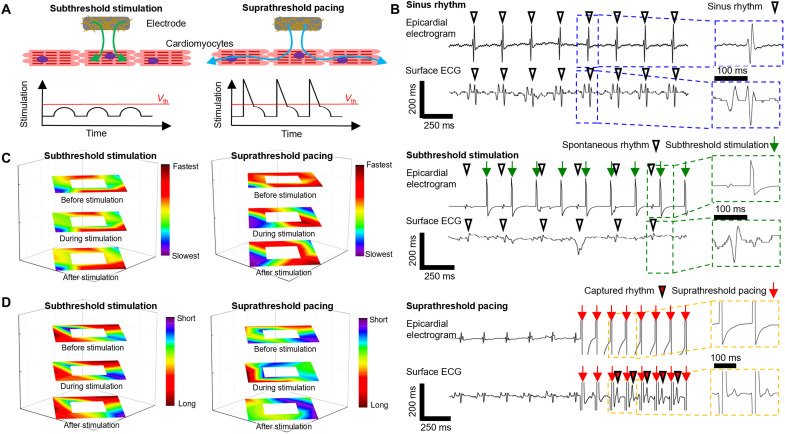
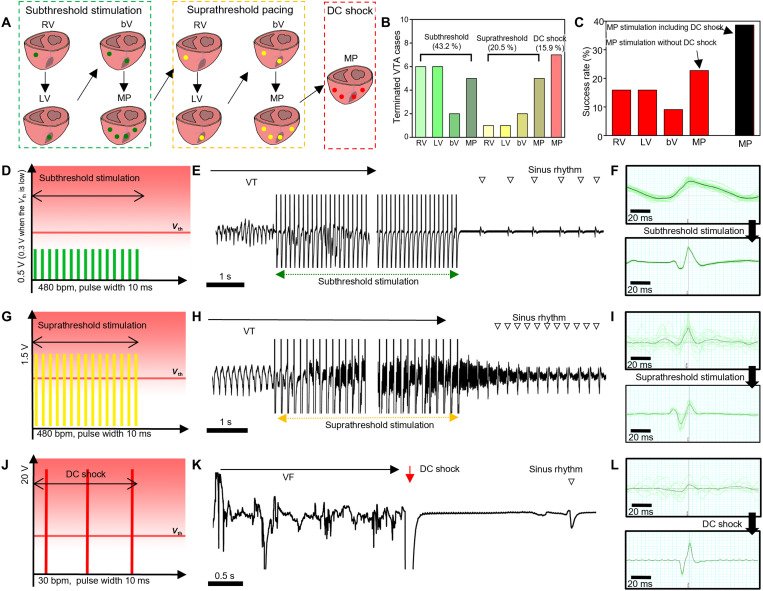
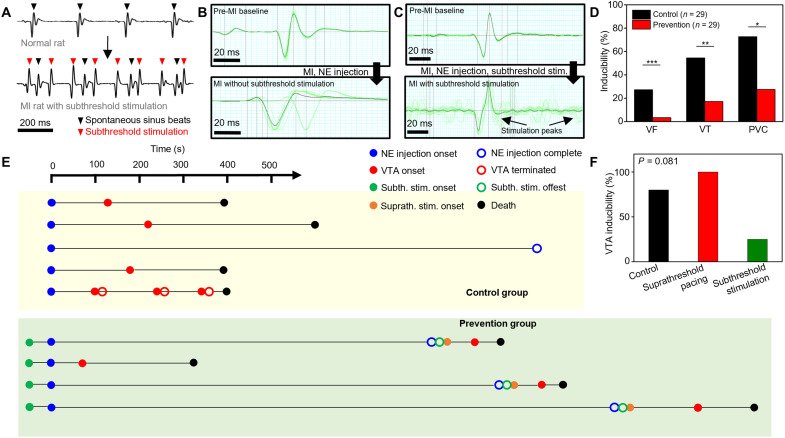
Fig. 1. Stimulation and shock protocols for conventional ICD and stretchable epicardial multichannel electrode array. (A) Illustration of suprathreshold stimulation and/or shock protocol using a conventional ICD. (i) Suprathreshold stimulations are delivered via a single transvenous electrode. (ii) Sequential stimulation protocol for VTA termination used in current clinical practice based on suprathreshold stimulations (yellow) and DC shocks (red). VTA may recur, in which case the stimulation sequence is repeated until VTA termination. Surface electrocardiograms reveal the cardiac electrical activity during the abovementioned stimulations. (B) Illustration of a stretchable epicardial multichannel electrode array in a MI heart for mapping local epicardial electrograms and delivering stimulations. (C) Illustration demonstrating the epicardial mapping of the propagation delay in the infarction area. (D) Illustration explaining the sequential stimulations for VTA termination using the epicardial multichannel electrode array. (i) VTA termination after subthreshold stimulation (green). (ii) If subthreshold stimulation for VTA termination is unsuccessful, then suprathreshold stimulation (yellow) is applied to terminate the VTA. (iii) If both subthreshold and suprathreshold stimulations for VTA termination are unsuccessful, then the DC shock (red) is applied. (E) Illustration explaining constant subthreshold stimulations (green) for potential VTA prevention.Fig. 2. Mapping local epicardial electrograms from each location of the ventricle using the epicardial multichannel electrode array. (A) Illustrations of the epicardial multichannel electrode array wrapping the entire ventricle. We describe the eight ventricular locations for mapping. (B) Representative mapping image of the propagation time in the normal (left) and MI (right) hearts. (C) Local electrogram duration measured from the eight ventricular locations using the multichannel electrode array in the normal (black; n = 4) and MI (red; n = 8) hearts. *P < 0.05, **P < 0.01, and ***P < 0.001. (D) Representative mapping image of the local capture threshold voltages in the normal (left) and MI (right) hearts. (E) Schematic illustration of the 32-channel electrode. Inset image describes the 32-channel electrode mounted on the extracted heart. (F) Representative propagation mapping image of the MI heart under sinus rhythm (left), during VT (middle), and during VF (right) using the 32-channel electrode. During focal VT, arrhythmia spreads from the infarcted region (dark red region with white star), whereas chaotic propagation was observed during the VF in a fragmented manner.Fig. 3. Comparison of the subthreshold stimulations and suprathreshold pacing. (A) Illustrations comparing the subthreshold stimulation and suprathreshold pacing. Subthreshold stimulation (left), electrical stimulation below the threshold voltage (Vth), is nonpropagative stimulation that does not provoke myocardial activation in the neighborhood myocardium. Suprathreshold stimulation (right), electrical stimulation above the threshold voltage, is propagative stimulation that elicits subsequent myocardial activation in the neighborhood. (B) Representative epicardial electrogram and surface electrocardiogram (ECG) during the sinus rhythm (top), subthreshold stimulation (middle), and suprathreshold pacing (bottom). Under subthreshold stimulation (green arrow), spontaneous sinus rhythm was constantly observed (downward white triangle) in the surface ECG, while the captured rhythm (downward red triangle) was observed under suprathreshold pacing (red arrow). Although the stimulation was typically applied at a rate of 480 beats per minute (bpm), a stimulation rate of 600 bpm was also used if the cyclic length was shorter, and hence, the stimulation rates can be different (green arrows and red arrows). This was because the tendency of the VTA induction was different between each animal. A single dose of norepinephrine was enough for the VTA induction in some animals, while multiple doses were needed in other animals. (C) Propagation map of the rabbit heart, constructed with the 13-channel electrode array. The left image shows the subthreshold stimulation propagation map from the epicardium before stimulation (top), during stimulation (middle), and after stimulation (bottom). The right image shows the suprathreshold pacing propagation map from the epicardium before stimulation (top), during stimulation (middle), and after stimulation (bottom). (D) Electrogram duration map of the rabbit heart constructed with the 13-channel concentric electrode array under subthreshold stimulation (left) and suprathreshold pacing (right).Fig. 4. Stimulation protocol and in vivo results for VTA termination using the stretchable epicardial multichannel electrode array. (A) Illustrations describing the sequential stimulation protocol for VTA termination. Green, yellow, and red dots indicate the locations of subthreshold stimulation, suprathreshold pacing, and DC shock, respectively. (B) Success rate of VTA termination per stimulation step. (C) Success rate of VTA termination per stimulation location. (D) Schematic illustration of subthreshold stimulation. (E) Surface ECG acquired during subthreshold stimulation. Sinus rhythm (downward unfilled triangle) was restored after subthreshold stimulation. The middle part of the ECG tracing was abbreviated for a more concise presentation of the stimulation and the termination of VTA. (F) Normalized ECG peaks before (top) and after (bottom) subthreshold stimulation. The black line corresponds to the average morphology of 20 peaks (green lines). (G) Schematic illustration of suprathreshold stimulation. (H) Surface ECG acquired during suprathreshold stimulations. Normal, but faster, sinus rhythm (downward unfilled triangle) was restored after suprathreshold stimulation. The middle part of the ECG tracing was abbreviated for a more concise presentation of the stimulation and the termination of VTA. (I) Normalized ECG peaks before (top) and after (bottom) suprathreshold stimulation. The black line corresponds to the average morphology of 20 peaks (green lines). (J) Schematic illustration of DC shock. (K) Surface ECG acquired during DC shock. (L) Normalized ECG peaks before (top) and after (bottom) DC shock. The black line corresponds to the average morphology of 20 peaks (green lines). bV, biventricular; MP, multipolar.Fig. 5. Prevention of potential VTAs using subthreshold stimulations. (A) Surface ECG from the prevention group rats before (top) and after (bottom) subthreshold stimulation. Black and red downward triangles indicate spontaneous sinus beats and subthreshold stimulation peaks, respectively. (B) Normalized rat surface ECG (black line) averaged from 20 peaks (green lines) in the control group before (top) and after (bottom) LAD coronary artery ligation and norepinephrine (NE) injection. (C) Normalized rat surface ECG (black line) averaged from 20 peaks (green lines) in the prevention group before (top) and after (bottom) LAD coronary artery ligation, norepinephrine injection, and subthreshold stimulation. (D) Inducibility of VTAs (VF, VT, and PVC) from the post-MI control group rats (black; n = 29) and post-MI prevention group rats (red; n = 29). *P < 0.05, **P < 0.01, and ***P < 0.001. (E) Timeline analysis of the VTA prevention experiments in rabbits. Starting from the norepinephrine injection, onset (filled circle) and offset (blank circle) time of the norepinephrine injection (blue), each VTA event (red), subthreshold stimulation (green), and suprathreshold pacing (orange) were marked on the timeline. The moment of death was marked as a black circle. (F) Graph comparing the VTA inducibility of the control group rabbit (black bar), subthreshold stimulation sequence of prevention group rabbit (green bar), and the suprathreshold pacing group rabbit (red bar).