SCI 발표논문

SCI 발표논문

← SCI 발표논문 목록

Clin Mol Hepatol. 2024;30(4):824-844.

DNA methylome analysis reveals epigenetic alteration of complement genes in advanced metabolic dysfunction-associated steatotic liver disease.

, , , , , , , , , , , , , ,

제1저자 Amal Magdy, 김희진 · 교신저자 김원, 김미랑

소속 (6)
  1. Aging Convergence Research Center, Korea Research Institute of Bioscience and Biotechnology (KRIBB), Daejeon, Korea.
  2. Department of Functional Genomics, KRIBB School of Bioscience, Korea University of Science and Technology (UST), Daejeon, Korea.
  3. Department of Biomedical Sciences, Seoul National University College of Medicine, Seoul, Korea.
  4. Department of Biomolecular Science, KRIBB School of Bioscience, UST, Daejeon, Korea.
  5. Department of Internal Medicine, Seoul National University College of Medicine, Seoul Metropolitan Government Boramae Medical Center, Seoul, Korea.
  6. College of Pharmacy and Research Institute of Pharmaceutical Sciences, Seoul National University, Seoul, Korea.

Abstract

BACKGROUND/AIMS Blocking the complement system is a promising strategy to impede the progression of metabolic dysfunction-associated steatotic liver disease (MASLD). However, the interplay between complement and MASLD remains to be elucidated. This comprehensive approach aimed to investigate the potential association between complement dysregulation and the histological severity of MASLD.

METHODS Liver biopsy specimens were procured from a cohort comprising 106 Korean individuals, which included 31 controls, 17 with isolated steatosis, and 58 with metabolic dysfunction-associated steatohepatitis (MASH). Utilizing the Infinium Methylation EPIC array, thorough analysis of methylation alterations in 61 complement genes was conducted. The expression and methylation of nine complement genes in a murine MASH model were examined using quantitative RT-PCR and pyrosequencing.

RESULTS Methylome and transcriptome analyses of liver biopsies revealed significant (P<0.05) hypermethylation and downregulation of C1R, C1S, C3, C6, C4BPA, and SERPING1, as well as hypomethylation (P<0.0005) and upregulation (P<0.05) of C5AR1, C7, and CD59, in association with the histological severity of MASLD. Furthermore, DNA methylation and the relative expression of nine complement genes in a MASH diet mouse model aligned with human data.

CONCLUSION Our research provides compelling evidence that epigenetic alterations in complement genes correlate with MASLD severity, offering valuable insights into the mechanisms driving MASLD progression, and suggests that inhibiting the function of certain complement proteins may be a promising strategy for managing MASLD.

Keywords

ComplementDNA methylationEpigeneticsMASHMASLD

Figures

Figure 1.
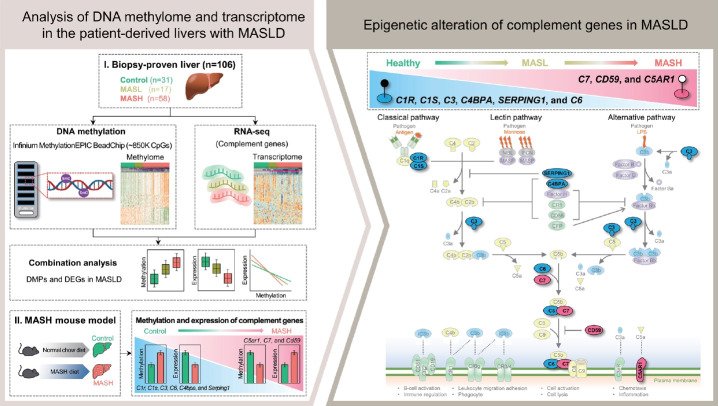
Figure 1. Altered methylation and expression of complement genes in MASLD progression. (A) Left: Schematic of the study design. MASL, metabolic dysfunction-associated steatotic liver; MASH, metabolic dysfunction-associated steatohepatitis; DMPs, differentially methylated CpG positions. Right: Simplified scheme of the complement system. Complement system activation comprises three proteolytic cascades called the classical, lectin, and alternative pathways, all converging at the activation of C3 convertase, a central point in complement activation. This cascade leads to the activation of crucial effectors such as the membrane attack complex (MAC) and anaphylatoxins (C3a and C5a). (B) Heatmap for DNA methylation of complement genes showing changes at CpG sites associated with MASLD progression in the ITEN cohort (106 samples). (C) Heatmap for mRNAs transcribed from complement genes showing changes related to MASLD progression in the ITEN cohort (92 samples).
Figure 2.
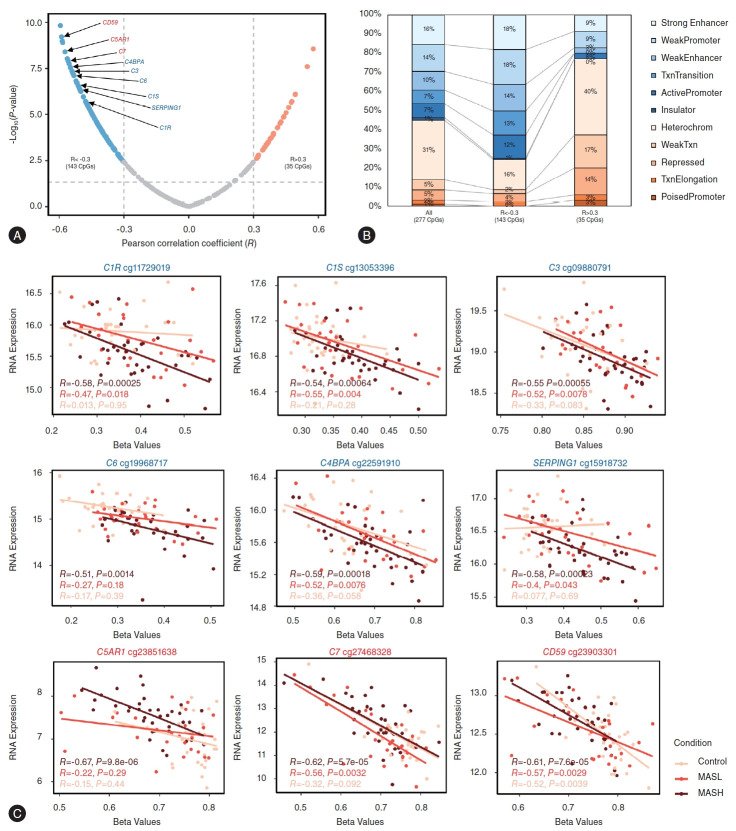
Figure 2. Relationship between DNA methylation and expression of complement genes. (A) Volcano plot depicting Pearson correlations between β values and gene expression values. Negative logarithm (base 10) of P-values plotted against Pearson correlations for complement genes. The horizontal dashed line indicates the significance threshold of adjusted P-value <0.05, and the vertical dashed lines denote the limits of −0.3 and 0.3 of the Pearson correlation coefficients. (B) Chromatin states and DNA methylation: Distribution of methylation in ChromHMM state elements [26], with each color representing a distinct ChromHMM state of the genome. The percentage of each ChromHMM state is shown for all CpG sites (left), inversely correlated CpGs (middle), and positively correlated CpGs (right). (C) Correlation between methylation β value and mRNAs transcribed from complement genes. Expression correlated inversely with DNA methylation. The y axis represents log2 transformed gene expression values and the x axis represents average β values.
Figure 3.
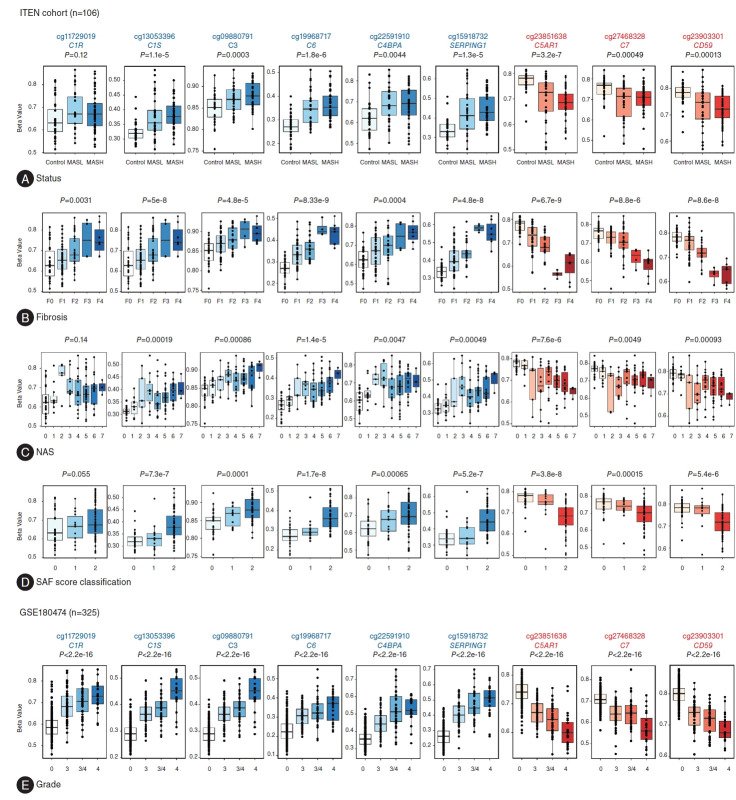
Figure 3. Methylation patterns of nine selected complement genes and correlations with the histological severity spectrum of MASLD. Boxplots illustrating highly differentially methylated complement-related CpG sites in MASLD stages using ITEN cohort data. (A) MASLD groups: Control (n=31), MASL (n=17), and MASH (n=58); (B) fibrotic stage: F0 (n=30), F1 (n=37), F2 (n=26), F3 (n=3), and F4 (n=10); (C) NAFLD activity score (NAS): 0 (n=20), 1 (n=11), 2 (n=5), 3 (n=9), 4 (n=15), 5 (n=31), 6 (n=12), and 7 (n=3); (D) SAF (steatosis, activity and fibrosis) score: 0 (n=31), 1 (n=15), and 2 (n=60). (E) Boxplots for the same CpG sites in the fibrotic stage based on public data (GSE180474) [4]. P-values indicate the significance of differences among groups (Kruskal–Wallis test). MASLD, metabolic dysfunction-associated steatotic liver disease; MASL, metabolic dysfunction-associated steatotic liver; MASH, metabolic dysfunction–associated steatohepatitis; NAFLD, nonalcoholic fatty liver disease.
Figure 4.
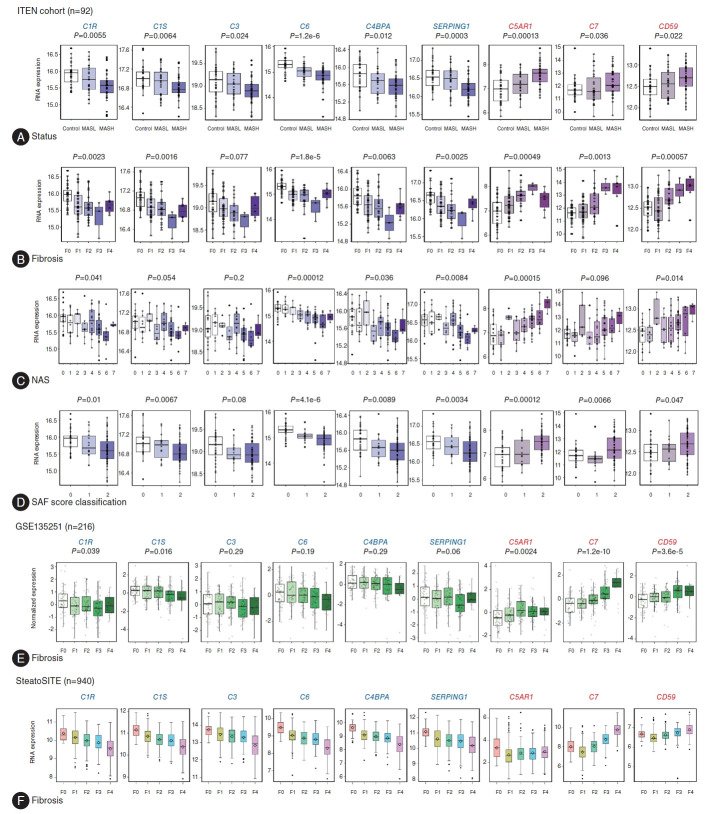
Figure 4. Gene expression patterns of the six hypermethylated and three hypomethylated genes in MASLD. Boxplots for mRNAs expressed according to MASLD stages using ITEN cohort data. (A) MASLD groups: Control (n=28), MASL (n=16), and MASH (n=48); (B) fibrotic stage: F0 (n=27), F1 (n=36), F2 (n=20), F3 (n=3), and F4 (n=6); (C) NAS: 0 (n=18), 1 (n=10), 2 (n=5), 3 (n=8), 4 (n=14), 5 (n=26), 6 (n=8), and 7 (n=3); (D) SAF score: 0 (n=28), 1 (n=14), and 2 (n=50). (E) Boxplots for mRNAs expressed during the fibrotic stage: F0 (n=46), F1 (n=48), F2 (n=54), F3 (n=54), and F4 (n=14) based on public data (GSE135251) [20]. P-values indicate the significance of differences among groups (Kruskal–Wallis test). (F) Expression of complement genes based on SteatoSITE (https://shiny.igc.ed.ac.uk/SteatoSITE_gene_explorer/), an open resource comprising data for 940 histologically defined MASLD patients [27]. MASLD, metabolic dysfunction-associated steatotic liver disease; MASL, metabolic dysfunction-associated steatotic liver; MASH, metabolic dysfunction–associated steatohepatitis; NAS, NAFLD activity score.
Figure 5.
Figure 5. Single-cell expression analysis of complement genes based on public data (GSE202379) [21]. (A) Dot plot showing expression of nine genes in each cell type. Circle size represents detection frequency, and color indicates expression level. (B–E) Violin plots showing expression scores for six complement genes in relation to four liver pathologies (B), lobular inflammation (C), ballooning (D), and fibrosis (E). (F) Dot plot showing the average expression of zonation-biased genes in each identified zone. Circle size denotes detection frequency, and color indicates expression level. (G) Violin plots showing expression scores for four complement genes. (H) Correlation between the levels of the six complement genes and liver zonation markers with disease progression.
Figure 6.
Figure 6. Methylation and expression patterns of nine complement genes in MASH mouse model. (A) Overall scheme for experimental MASH diet mouse model. Experimental MASH was induced in C57BL/6 male mice using a high-fat, high-sucrose diet for 14 weeks. (B) Pyrosequencing and (C) RT-qPCR were performed on nine complement genes in the control group (n=5) and MASH group (n=7). P-values indicate the significance of differences between control and MASH mice using the Mann–Whitney U test. **P<0.01; *P<0.05. MASH, metabolic dysfunction–associated steatohepatitis.

그림 출처: PubMed Central 공개 논문 (PMC11540403)

Conflict of interest statement

Conflicts of Interest . The authors declare no competing interests.

그 밖의 정보
출판 형태
Journal Article
저널
Clinical and molecular hepatology · eISSN 2287-285X
전자 출판
2024-07-25
MeSH
DNA Methylation* · Animals · Humans · Epigenesis, Genetic* · Male · Mice · Middle Aged · Complement System Proteins* / metabolism / genetics · Female · Fatty Liver* / genetics / metabolism / pathology · Adult · Liver / metabolism / pathology · Disease Models, Animal · Epigenome · Mice, Inbred C57BL
Substances
Complement System Proteins
연구비
National Research Foundation of Korea RS-2024-00440883 · National Research Foundation of Korea 2023R1A2C1003339 · National Research Foundation of Korea 2021R1A2C2005820 · National Research Foundation of Korea 2022M3A9B6017654 · National Research Foundation of Korea RS-2023-00223831 · National Research Foundation of Korea 2021M3A9E4021818 · Korea Health Industry Development Institute · Ministry of Health and Welfare HI21C0538 · National Research Council of Science and Technology · Aging Convergence Research Center CRC22013-400 · Korea National Institute of Health 2022ER090202 · Korea Research Institute of Bioscience and Biotechnology KGM5192423 · Seoul Metropolitan Government Seoul National University Boramae Medical Center 04-2023-0032 · Seoul Metropolitan Government Seoul National University Boramae Medical Center 04-2023-0033
참고문헌
52편