Department of Internal Medicine, Seoul National University College of Medicine, Seoul, Korea.
Abstract
Bisphenol A (BPA) has been reported to possess hepatic toxicity. We investigated the hypothesis that BPA, below the no observed adverse effect level (NOAEL), can induce hepatic damage and mitochondrial dysfunction by increasing oxidative stress in the liver. Two doses of BPA, 0.05 and 1.2 mg/kg body weight/day, were administered intraperitoneally for 5 days to mice. Both treatments impaired the structure of the hepatic mitochondria, although oxygen consumption rate and expression of the respiratory complex decreased only at the higher dose. The hepatic levels of malondialdehyde (MDA), a naturally occurring product of lipid peroxidation, increased, while the expression of glutathione peroxidase 3 (GPx3) decreased, after BPA treatment. The expression levels of proinflammatory cytokines such as interleukin-6 (IL-6) and tumor necrosis factor-α (TNF-α) also increased. In HepG2 cells, 10 or 100 nM of BPA also decreased the oxygen consumption rate, ATP production, and the mitochondrial membrane potential. In conclusion, doses of BPA below the NOAEL induce mitochondrial dysfunction in the liver, and this is associated with an increase in oxidative stress and inflammation.
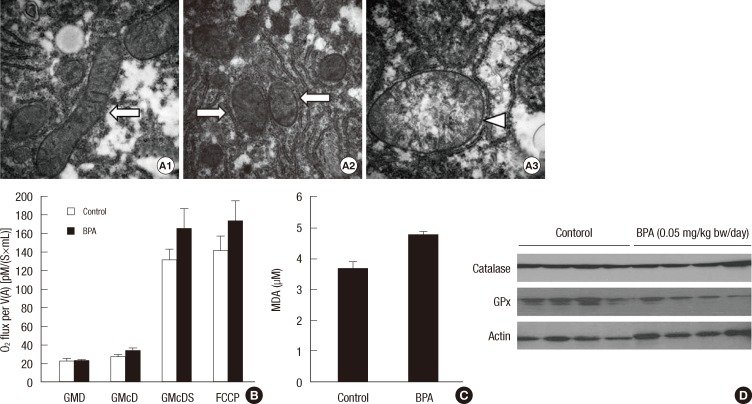
Fig. 1Structure and function of hepatic mitochondria in the mice treated with 1.2 mg/kg bw/day of BPA for 5 days. (A) Morphology of hepatic mitochondria by transmission electron microscopy (150,000 × magnification). Control mice (A1) and BPA-treated mice (A2). Normal mitochondria (arrows) and swollen mitochondria (arrowheads). (B) Oxygen consumption rate of hepatic mitochondria. GMD, glutamate + malate + ADP; GMcD, GMD + cytochrome c; GMcDS, GMcD + succinate; FCCP, uncoupler (*P < 0.05 compared to control). (C) The respiratory complex I-V of hepatic mitochondria.Fig. 2Serum AST and ALT levels after a single injection of 1.2 mg/kg bw/day of BPA.Fig. 3Changes in the levels of oxidative stress and inflammatory cytokines at 1, 6, and 24 hr after a single injection of BPA (1.2 mg/kg bw/day). (A) MDA concentrations in the liver. (B) Catalase and GPx3 in the liver. (C) IL-6 and TNF-α levels in the liver. (D) Serum IL-6 and TNF-α levels. (E) Oxygen consumption rate in hepatic mitochondria. GMD, glutamate + malate + ADP; GMcD, GMD + cytochrome c; GMcDS, GMcD + succinate (*P < 0.05 compared to control).Fig. 4Oxidative stress in the liver of mice treated with BPA (1.2 mg/kg bw/day) for 5 days. (A) MDA concentrations (*P < 0.05 compared to control). (B) Catalase and GPx3 in the liver.Fig. 5Structure and function of hepatic mitochondria in the mice treated with BPA (0.05 mg/kg bw/day) for 5 days. (A) Morphology of hepatic mitochondria by transmission electron microscopy (500,000 × magnification). Control (A1) and BPA-treated mice (A2, A3). Normal mitochondria (arrows) and swollen and cristae-disrupted mitochondria (arrowhead). (B) Oxygen consumption rate of hepatic mitochondria. GMD, glutamate + malate + ADP; GMcD, GMD + cytochrome c; GMcDS, GMcD + succinate; FCCP, uncoupler. (C) MDA concentrations in the liver. (D) Catalase and GPx3 in the liver.Fig. 6Structure and function of the mitochondria in HepG2 cells treated with BPA. (A) Mitochondrial morphology of HepG2 cells by transmission electron microscopy (300,000 × magnification). Control HepG2 cells (A1), 10 nM BPA-treated HepG2 cells (A2), and 100 nM BPA-treated HepG2 cells (A3). Normal mitochondria (arrows) and swollen and cristae-disrupted mitochondria (arrowheads). (B) Oxygen consumption rate of HepG2 cells. GMD, glutamate + malate + ADP; GMcD, GMD + cytochrome c; GMcDS, GMcD + succinate; FCCP, uncoupler. (C) ATP production after the treatment with 100 nM BPA. (D) MMP after the treatment with 10 or 100 nM BPA (*P < 0.05 compared to control; †P < 0.01 compared to control).Fig. 7Oxidative stress in HepG2 cells treated with 100 nM BPA. (A) MDA concentrations determined by a TBARS assay kit. (B) Fluorescence after the ROS-sensitive indicator DHE staining. Control (B1), 2 hr (B2), 6 hr (B3), and 24 hr (B4) after the treatment of 100 nM BPA.
그림 출처: PubMed Central 공개 논문 (PMC3369451)
그 밖의 정보
출판 형태
Journal Article, Research Support, Non-U.S. Gov't
저널
Journal of Korean medical science · eISSN 1598-6357