Establishment and characterization of 24 breast cancer cell lines and 3 breast cancer organoids reveals molecular heterogeneity and drug response variability in malignant pleural effusion-derived models.
Cancer Research Institute, Seoul National University, Seoul, 03080, Republic of Korea.
Medical Research Center, Ischemic/Hypoxic Disease Institute, Seoul National University College of Medicine, Seoul, 03080, Republic of Korea.
Division of Data Science, College of Information and Communication Technology, The University of Suwon, Hwaseong, 18323, Republic of Korea.
Department of Internal Medicine, Seoul National University Hospital, Seoul National University College of Medicine, Seoul, 03080, Republic of Korea.
Department of Pathology, Seoul National University Hospital, Seoul, 03080, Republic of Korea.
Department of Internal Medicine, Seoul Metropolitan Government Seoul National University Boramae Medical Center, Seoul, 07061, Republic of Korea.
Cancer Research Institute, Seoul National University, Seoul, 03080, Republic of Korea. moisa@snu.ac.kr.
Department of Internal Medicine, Seoul National University Hospital, Seoul National University College of Medicine, Seoul, 03080, Republic of Korea. moisa@snu.ac.kr.
Cancer Research Institute, Seoul National University, Seoul, 03080, Republic of Korea. kujalok@snu.ac.kr.
Department of Biomedical Sciences, Seoul National University College of Medicine, Seoul, 03080, Republic of Korea. kujalok@snu.ac.kr.
Medical Research Center, Ischemic/Hypoxic Disease Institute, Seoul National University College of Medicine, Seoul, 03080, Republic of Korea. kujalok@snu.ac.kr.
Abstract
Intratumoral heterogeneity of breast cancer cells causes undesired drug resistance and predispose to disease recurrence. We investigate the molecular heterogeneity of breast cancer cells derived from malignant pleural effusions (MPE) to understand variations in drug resistance and cellular evolution. MPE provides a unique environment, with cells experiencing significant microenvironmental changes that promote intratumoral heterogeneity and therapeutic resistance. By establishing 24 cell lines and 3 organoids from MPE samples of breast cancer patients, we performed extensive genomic, transcriptomic, and drug sensitivity analyses. Our findings reveal substantial genetic and transcriptomic diversity among MPE-derived cell lines, highlighting dynamic alterations in driver mutations and signaling pathways that correlate with variable drug responses. Notably, temporal and spatial heterogeneity within patient-derived samples emphasized the adaptability of breast cancer cells in MPE, as different subclones displayed distinct drug sensitivities. This work underscores the critical role of molecular profiling in understanding treatment resistance in breast cancer, presenting MPE-derived cell lines as valuable preclinical models for exploring personalized therapies in aggressive cancer phenotypes.
Breast CancerDrug ScreeningIntratumoral HeterogeneityMalignant Pleural EffusionNext Generation Sequencing
Figures
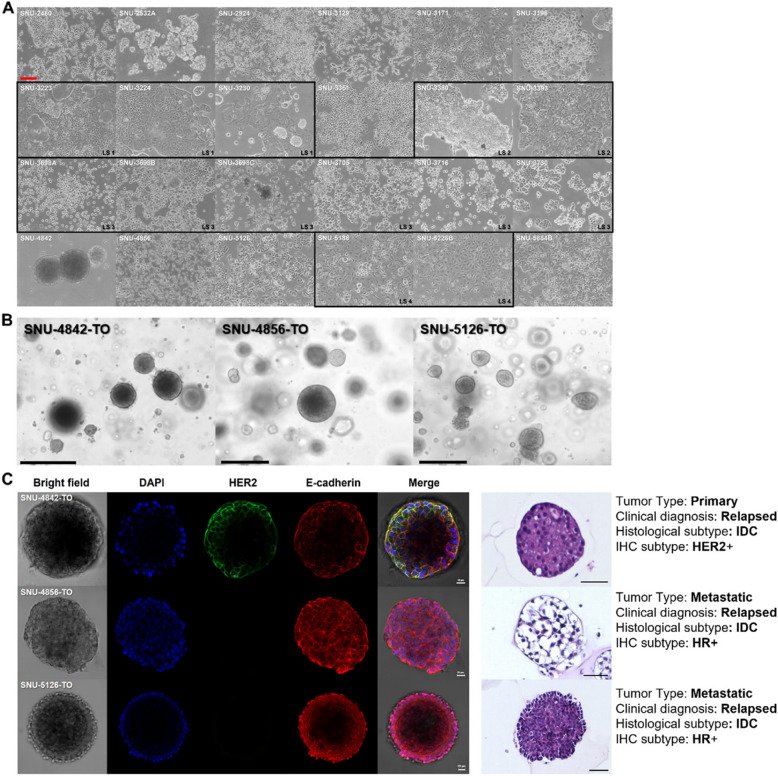
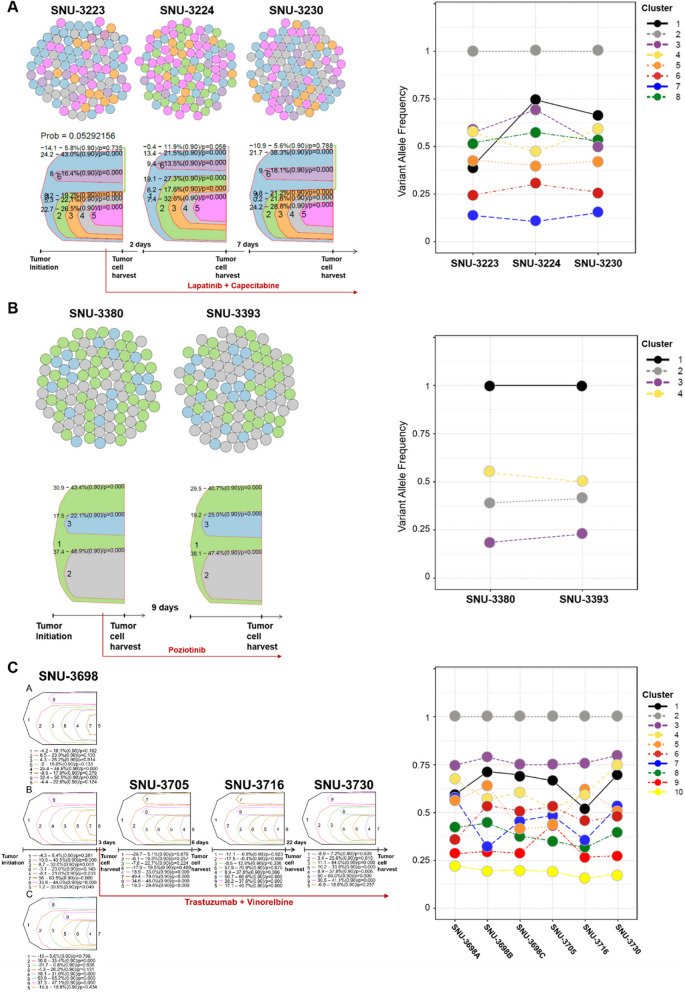
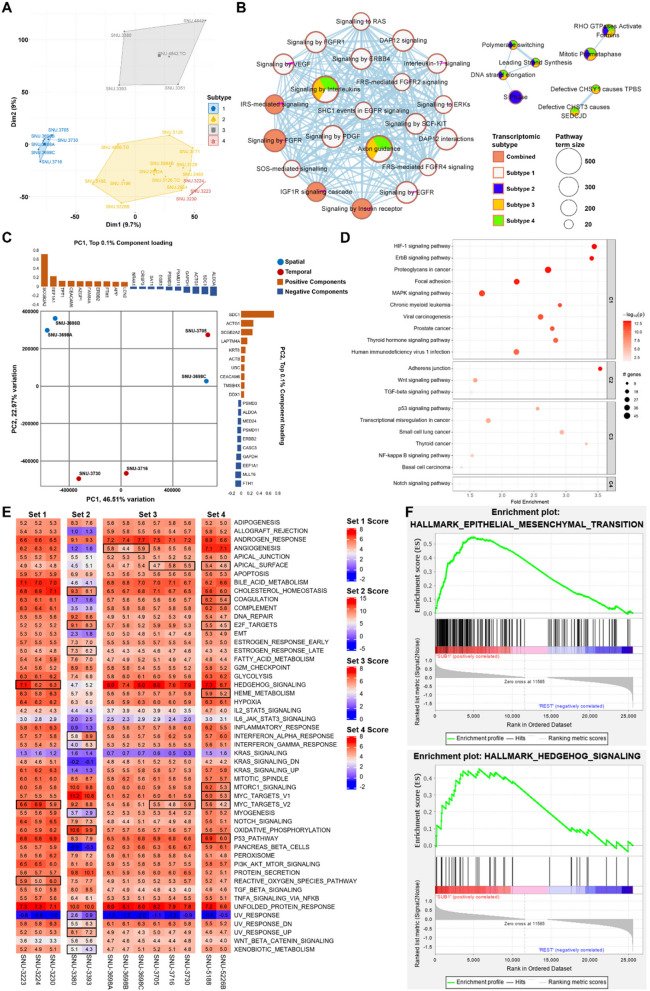
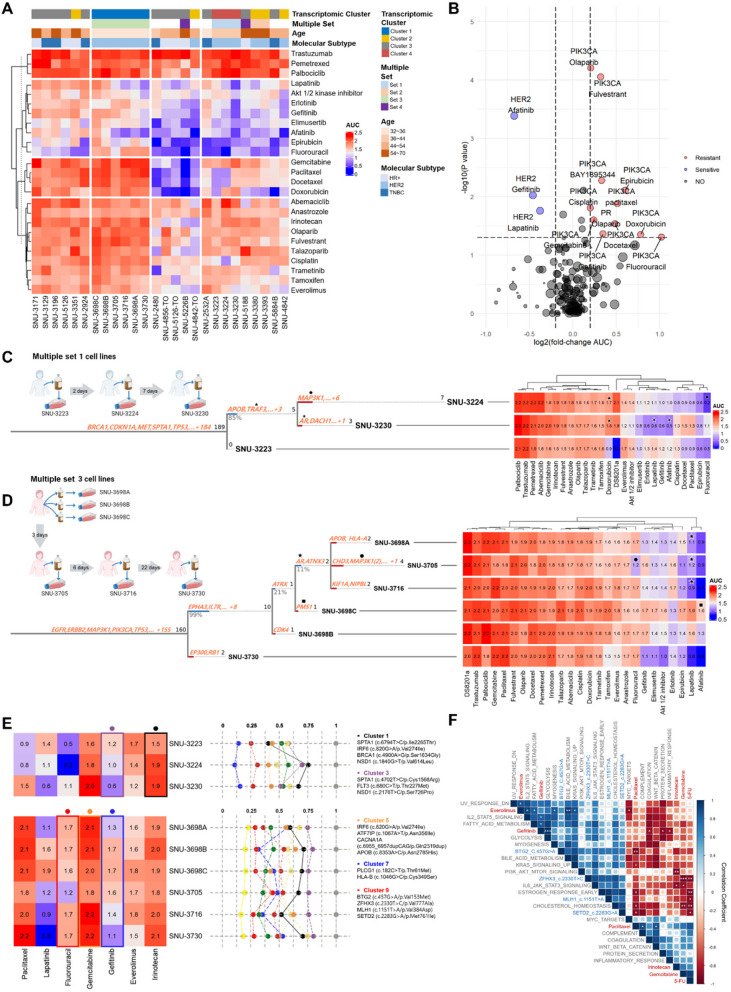
Fig. 1The morphologies of MPE-derived human breast cancer In Vitro models exhibited heterogeneous patterns. A Majority of cell lines grow as adherent form, suggesting cells floating in the pleural cavity maintained the capability to adhere. Various growth patterns include polygonal (n = 8), fibroblast-like (n = 1), round (n = 9), oval (n = 1) and mixed (n = 5) form. The names of cell lines are indicated upper-left corner. Multiply collected samples from the same patient are indicated with black squares. Scale bar = 200 μm. B Bright field images of three PDX-derived organoids displayed mostly spheroidal and asymmetric morphologies. Scale bar = 100 μm. C Immunocytochemistry of PDX-derived organoids and hematoxylin–eosin (H&E) staining of paraffin sections demonstrated organoids maintained the characteristics of the original breast tumor. Scale bar = 20 μmFig. 2Intratumoral heterogeneity within malignant pleural effusions of breast cancer patients. A-C Clonal estimation of the multiple set 1–3. Calculated subclones and their proportions among a tumor population within the MPE are indicated with colored circles and fish plots using representative colors. The number of colored circles per each harvesting point is set to 100. The time intervals for collecting tumor cells and applied antitumor drugs are indicated below the fish plot. The VAFs of mutational clusters per multiple collected samples are indicated with a broken line graphs with representative colors. The clone numbers corresponding to the line graphs in Fig. 2 are provided on the right side of each graph, and the associated gene mutations with significantly changed VAFs are detailed in Table S4 A–4 C. The subclones of multiple set 4 could not be estimated with identical parameters and omitted from the clonal analysis. See also Table S3 A-3 C and S4 A-4 CFig. 3Multiple sets of MPE-derived breast tumor cell lines revealed patient-specific transcriptomic alteration. A Principle component analysis (PCA) showed high level of inter-patient heterogeneity. A total of 4 transcriptomic subtypes are identified with PCA. Each subtype is indicated with connected lines and representative colors. B See also Table S5. Multivariate pathway enrichment analysis identifies gene sets that are over-represented across transcriptomic subtypes. Four transcriptomic subtypes identified from PCA are used to estimate pathway aberrations, each indicated by a representative color. Pathways associated with all four subtypes are labeled as “Combined.” The size of each circle corresponds to the pathway term size, representing the number of genes in each pathway. Only pathways with statistically significant enrichment (adjusted p < 0.05) are shown. The filled colors within each circle represent the transcriptomic subtypes contributing to the enrichment of each pathway. C See also Table S6. PCA of Multiple set 3 validates spatiotemporal heterogeneity of MPE-derived breast tumor cell. The principle component 1 (PC1) separates spatially heterogeneous samples with 46.51% of total variation, whereas the principle component 2 (PC2) divides temporally heterogeneous samples with 22.97% of total variation (n = 27,681). Top 0.1% component loadings of PC1 and PC2 were indicated on the top and right side of the PCA plot respectively. D See also Table S7. Pathway enrichment analysis of loading components that account for temporal heterogeneity. The log-transformed p-values are indicated with gradient colors. A value of p <.05 is considered statistically significant. The size of the circle is proportional to the sample size. The fold enrichment is indicated on the x-axis, and the names of enriched pathways are indicated on the y-axis. E Table S8. Normalized enrichment scores (NES) for each Multiple set using single sample gene set enrichment analysis (ssGSEA) display overall temporal transcriptomic changes of MPE samples. Pathways with standard deviation > 0.5 of NES were highlighted with black squares. F EMT and hedgehog signaling pathways are distinctively expressed in the set 2. The statistical settings for GSEA analysis is as follows (Number of permutations = 1000, Permutation type = phenotype, Chip platform = MSigDB.v.7.4.chip, Enrichment statistic = weighted, Max size: exclude larger sets = 500, Min size: exclude smaller sets = 15)Fig. 4MPE-derived breast tumor in-vitro models reveal heterogeneous drug responses caused by molecular diversity. A See also Table S10 A. A heatmap of MPE-derived breast tumor in-vitro models exhibited heterogeneous distribution of 25 compounds according to their molecular characteristics. The names of compounds are provided on the right. The cell lines and drugs were k-means clustered based on the AUC values across the drug panel. Multiple factors that potentially contribute to the heterogeneous drug responses are indicated above the heatmap. The normality of each drug response was estimated with Shapiro–Wilk test. The p-values < 0.05 was considered as normally distributed data. B See also Table S10B, C. Gene-drug interaction analysis using Wilcoxon ranked sum test. Each dot indicated a pair of gene and drug. The size of circle is proportional to pair count. The absolute log fold change of AUC value > 0.2 and p < 0.05 were considered as significant. C, D. Multiple cell lines reveal heterogeneous drug responses caused by mutational ITH. Shifting mutational landscape during temporal evolution was associated to heterogeneous drug responses (marked with plane figures). The Treeomics statistical settings were as follows (sequencing error rate = 0.005, prior absent probability = 0.5, max absent VAF = 0.05, LOH frequency = 0, false discovery rate = 0.05, false-positive rate = 0.005, and absent classification minimum coverage = 100). E. Longitudinal tracking of mutational fraction revealed drug-associated variant clusters. Each cluster was highlighted with representative colors. Mutational clusters related to varying drug responses were marked with colored dot on the top of the drug heatmap. F. See also Table S11. Correlation plot shows the statistical association of molecular factors contributing to subclonal cell fractions including the VAFs of representative mutations and NES of specific pathways to certain drugs. The Pearson correlation coefficient (R) with p-values between the molecular factors and AUC of six drugs are represented. (Blue: positive correlation; Red: negative correlation). Significance codes: ‘***’ p < 0.001; ‘**’ p < 0.01; ‘*’ p < 0.05
그림 출처: PubMed Central 공개 논문 (PMC12044882)
Conflict of interest statement
Declarations. Ethics approval and consent to participate: The research protocol was reviewed and approved by the institutional review board of the Seoul National University Hospital (IRB No. 1102–098-357). The study was performed in accordance with the Declaration of Helsinki. Written informed consent was obtained from all patients enrolled in this study. Consent for publication: Not applicable. Competing interests: Seock-Ah Im received research fund from AstraZeneca, Boryung, Eisai, and Pfizer outside of this research work. Seock-Ah Im has advisory role for AstraZeneca, Eisai, Eli-Lilly, MSD, Novartis, Roche, Pfizer outside of this research work.
National Research Foundation of Korea 2021M3H9A1030151, NRF2022R1A5A102641311, 2022M3A9B6018217 · National Research Foundation of Korea 2021M3H9A1030151, NRF2022R1A5A102641311, 2022M3A9B6018217 · National Research Foundation of Korea 2021M3H9A1030151, NRF2022R1A5A102641311, 2022M3A9B6018217 · National Research Foundation of Korea 2021M3H9A1030151, NRF2022R1A5A102641311, 2022M3A9B6018217 · National Research Foundation of Korea 2021M3H9A1030151, NRF2022R1A5A102641311, 2022M3A9B6018217 · National R&D Program for Cancer Control through the National Cancer Center (NCC) funded by the Ministry of Health & Welfare, Republic of Korea HA22C0111 · National R&D Program for Cancer Control through the National Cancer Center (NCC) funded by the Ministry of Health & Welfare, Republic of Korea HA22C0111 · National R&D Program for Cancer Control through the National Cancer Center (NCC) funded by the Ministry of Health & Welfare, Republic of Korea HA22C0111 · National R&D Program for Cancer Control through the National Cancer Center (NCC) funded by the Ministry of Health & Welfare, Republic of Korea HA22C0111 · National R&D Program for Cancer Control through the National Cancer Center (NCC) funded by the Ministry of Health & Welfare, Republic of Korea HA22C0111 · National R&D Program for Cancer Control through the National Cancer Center (NCC) funded by the Ministry of Health & Welfare, Republic of Korea HA22C0111 · National R&D Program for Cancer Control through the National Cancer Center (NCC) funded by the Ministry of Health & Welfare, Republic of Korea HA22C0111 · National R&D Program for Cancer Control through the National Cancer Center (NCC) funded by the Ministry of Health & Welfare, Republic of Korea HA22C0111 · National R&D Program for Cancer Control through the National Cancer Center (NCC) funded by the Ministry of Health & Welfare, Republic of Korea HA22C0111