Department of Internal Medicine, Seoul National University Bundang Hospital, Seongnam, South Korea.
Department of Internal Medicine and Liver Research Institute, Seoul National University College of Medicine, Seoul, South Korea.
Tumor Microenvironment Global Core Research Center, College of Pharmacy, Seoul National University, Seoul, South Korea.
Abstract
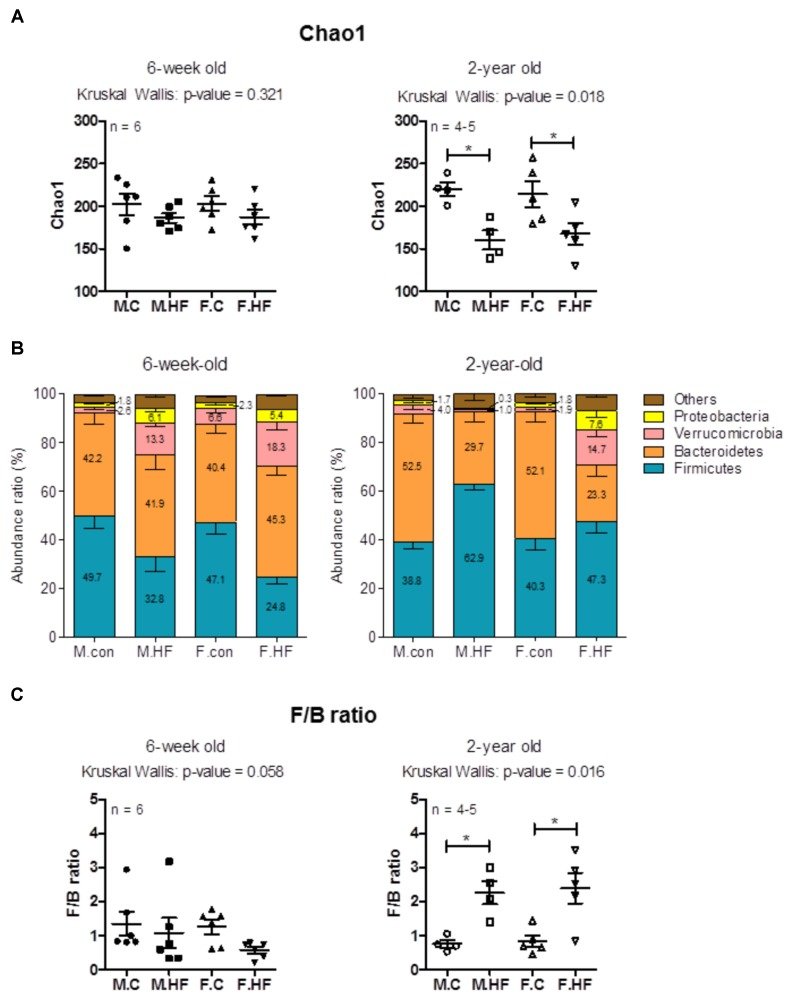
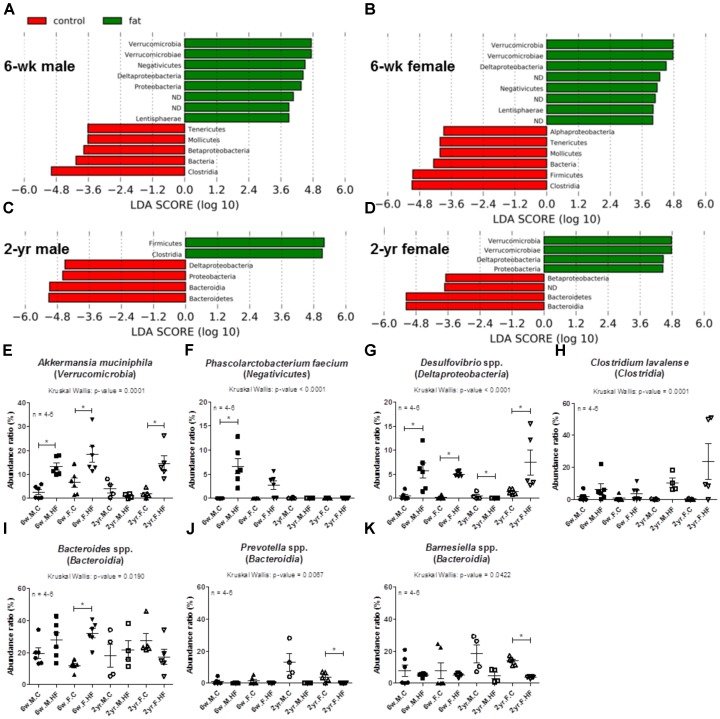
Gut microbiota, an important component that affects host health, change rapidly and directly in response to altered diet composition. Recently, the role of diet-microbiome interaction on the development of colon cancer has been the focus of interest. Colon cancer occurs more frequently in an aged population, and in males. However, the effect of dietary changes on the gut microbiome has been studied mainly in young males, even though it may vary with age and sex. The aim of this study was to investigate microbial changes and host response in the colons of male and female 6-week-old (young) and 2-year-old (old) Fisher-344 rats exposed to a high-fat diet (HFD). Our results showed that exposure to HFD for 8 weeks decreased the species richness of microbiota (Chao1) and increased Firmicutes/Bacteroidetes ratio only in aged rats, and not in young rats. Sex differences underlying the alteration by HFD in the gut microbiome were observed in the microbiome of aged rats. For instance, the abundance ratio of Akkermansia muciniphila and Desulfovibrio spp. increased in response to HFD in young rats and female aged rats, but not in male aged rats. Histological inflammation and cell proliferation of colon mucosa (indexed by Ki67) were significantly increased by HFD even in young rats; aged rats showed significantly higher cell proliferation in the HFD group than in the control. The HFD-induced decrease of species richness and the increase in specific species (Desulfovibrio spp. and Clostridium lavalense), which produce carcinogenic compounds such as H2S and N-nitroso compounds, were significantly correlated with Ki67 index. In colon mucosa, the concentration of myeloperoxidase was increased by HFD only in males, and not in females. In conclusion, the results suggest a link between HFD-induced gut dysbiosis (particularly the low species richness and high abundance ratios of Desulfovibrio spp. and C. lavalense) and cell proliferation of colon mucosa (indicated by Ki67 IHC). In addition, sex differences influence the response of gut microbiome to HFD particularly in old age. Such sex differences in the gut microbiota might be related to sex differences in inflammation in the colon mucosa.
Keywords
Ki67aginggut microbiotahigh-fat dietrats
Figures
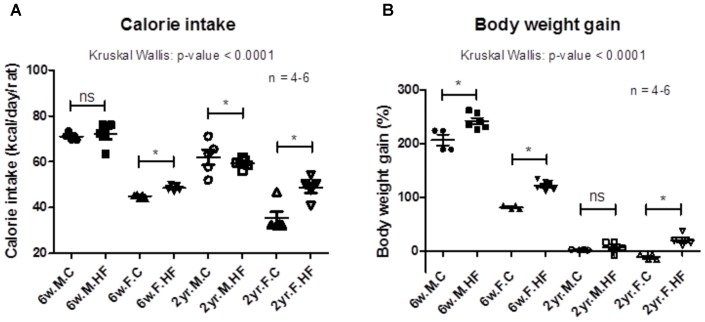
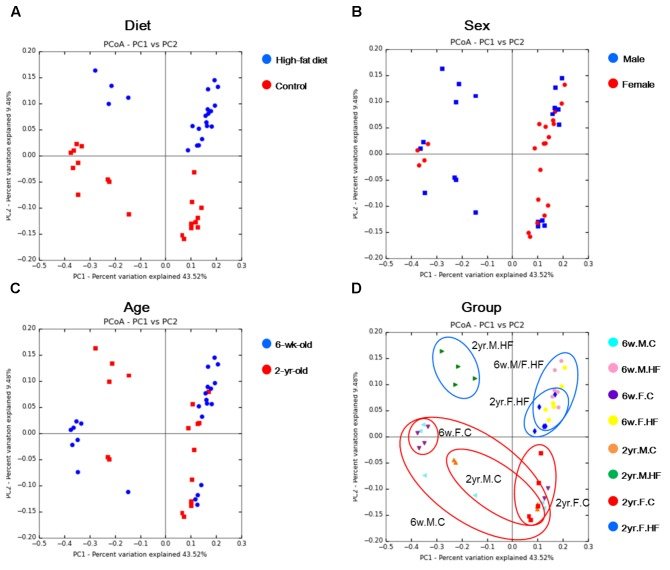
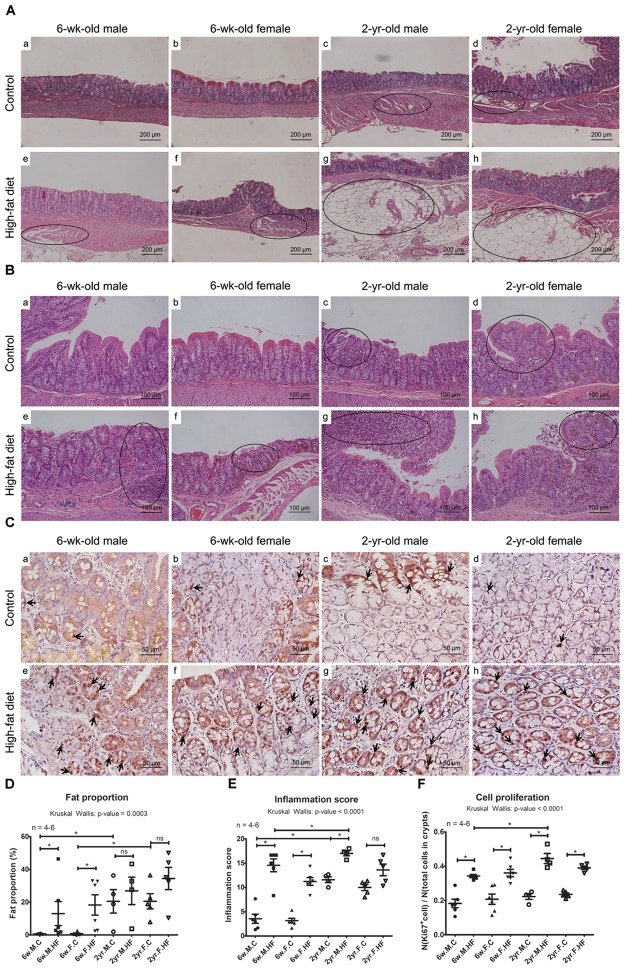
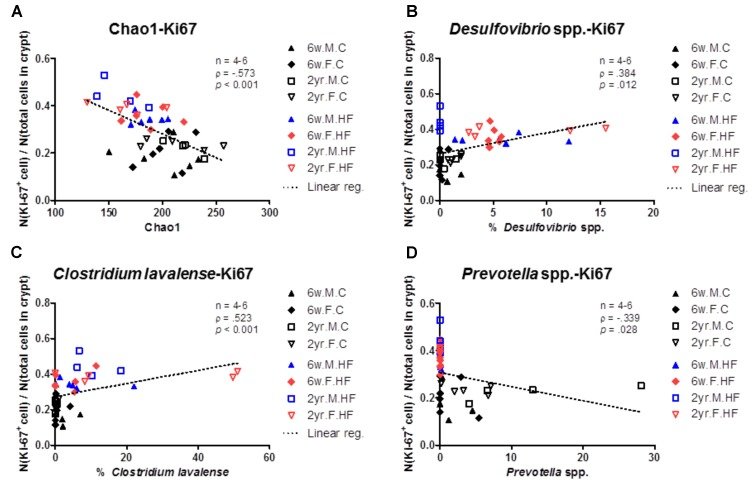
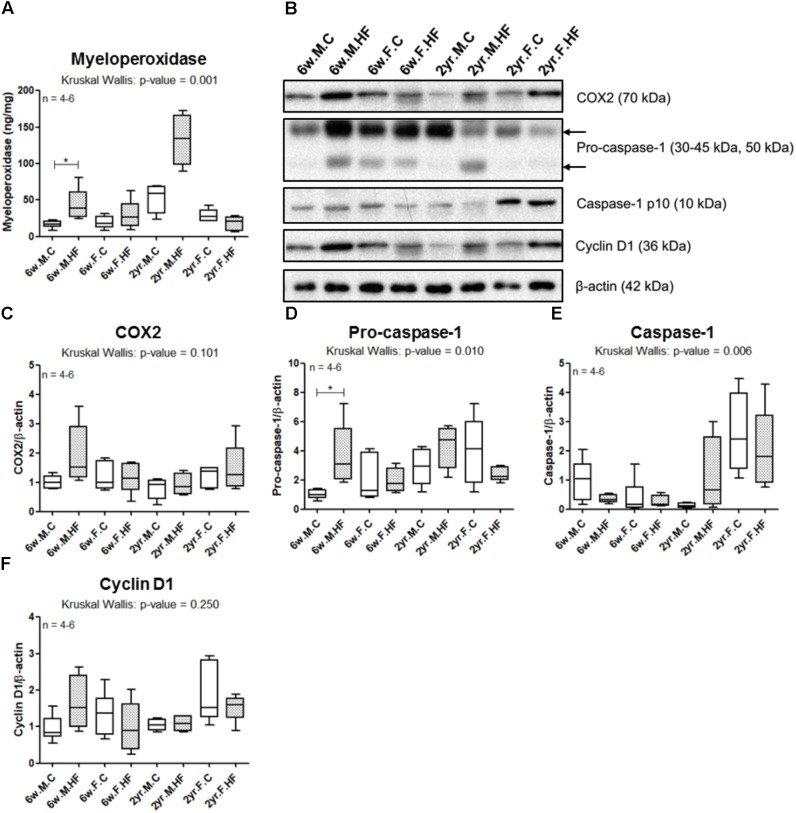
FIGURE 1Calorie intake (A) and changes in body weight (B) during the 8-week feeding of control or high-fat diet (6-week-old rats, n = 6; 2-year-old male rats, n = 4; 2-year-old female rats, n = 5). Data are expressed as mean and SEM; p-values to Kruskal–Wallis test is designated on the figure; ∗p < 0.05 according to Mann–Whitney U-test with Holm–Bonferroni correction; M, male; F, female; HF, high-fat diet.FIGURE 2PCoA plots of two ages per diet (A), sex (B), age (C), and experimental groups (D). Metagenome sequencing was performed with 16S rRNA from rat fecal samples. UniFrac-based PCoA was performed on the metagenome sequencing data. 6w.M.C (n = 6); 6w.M.HF (n = 6); 6w.F.C (n = 6); 6w.F.HF (n = 6); 2yr.M.C (n = 4); 2yr.M.HF (n = 4); 2yr.F.C (n = 5); 2yr.F.HF (n = 6). 6w, 6-week-old; 2yr, 2-year-old; M, male; F, female; C, control; HF, high-fat diet.FIGURE 3Analysis of species richness and relative abundance ratios of 6-week- and 2-year-old rats. (A) Species richness (Chao1 index) of the microbial community determined using pyrosequencing. (B) Taxonomic composition at the phylum level. The abundance ratio (%) indicates the percentage of each phylum in total microorganisms. Stacked bars of mean and SEM. (C)Firmicutes/Bacteroidetes ratio calculated by dividing the abundance ratio of Firmicutes with that of Bacteroidetes in 6-week- and 2-year-old rats. (A and C) Scatter plot (mean, SEM) (6-week-old rats, n = 6; 2-year-old male rats, n = 4; 2-year-old female rats, n = 5). p-Values to Kruskal–Wallis test is designated on the figure; M, male; F, female; C, control; HF, high-fat diet; F/B ratio, Firmicutes/Bacteroidetes ratio.FIGURE 4Alterations in the abundance ratio of classes and major species following exposure to high-fat diet. LDA effect size (LEfSe) analyses compared the alterations in microbiome according to the diet at the class level. Negative LDA scores (red) are enriched in controls and positive LDA scores (green) are enriched in high-fat diet groups of 6-week-old male (A), 6-week-old female (B), 2-year-old male (C), and 2-year-old female (D). Abundance ratios (%) of Akkermansia muciniphila(E), Phascolarctobacterium faecium(F), Desulfovibrio spp. (G), Clostridium lavalense(H), Bacteroides spp. (I), Prevotella spp. (J), and Barnesiella spp. (K) were analyzed according to diet and age. Scatter plot (mean, SEM) (6-week-old rats, n = 6; 2-year-old male rats, n = 4; 2-year-old female rats, n = 5); p-values to Kruskal–Wallis test is designated on the figure; ∗p < 0.05 according to Mann–Whitney U-test with Holm–Bonferroni correction; 6w, 6-week-old; 2yr, 2-year-old; M, male; F, female; C, control; HF, high-fat diet.FIGURE 5Histological analysis of colonic tissues. Fat deposition (A) and inflammation (B) in the photomicroscopy of H&E stain of ascending colons (A: ×200 magnifications; B: ×100 magnifications). Dotted circles represent regions with fat deposition or inflammation. (C) Immunohistochemical images of Ki67 (×400 magnifications). Arrows indicate representative Ki67-immunoreactive cells. (D) Fat proportion (%) in total smooth muscle area. (E) Inflammation scores of colonic epithelial damage and inflammatory cell infiltration in mucosa, submucosa, and muscle layers. (F) The Ki67 proliferation index calculated by dividing the number of Ki67-stained cells with the number of total cells within all crypts. Scatter plot (mean, SEM) (6-week-old rats, n = 6; 2-year-old male rats, n = 4; 2-year-old female rats, n = 5). p-Values to Kruskal–Wallis test is designated on the figure; ∗p < 0.05 according to Mann–Whitney U-test with Holm–Bonferroni correction. M, male; F, female; C, control; HF, high-fat diet; Control groups of 6-week-old male (a), 6-week-old female (b), 2-year-old male (c), 2-year-old female (d), and high-fat diet groups of 6-week-old male (e), 6-week-old female (f), 2-year-old male (g), and 2-year-old female (h).FIGURE 6Correlation between gut microbiome and cell proliferation index. Species richness (Chao1) (A), abundance ratios (%) of Desulfovibrio spp. (B), Clostridium lavalense(C), and Prevotella spp. (D) were significantly correlated with cell proliferation index of colonic mucosa (N(Ki67 + cell)/N(total cells in crypts). p < 0.05 to Spearman’s correlation (A–D). Dotted line indicates the regression line. The correlations were analyzed with Spearman’s rank correlation coefficient method (also known as Spearman’s rho) and linear regression.FIGURE 7Inflammation and proliferation markers in colonic mucosa. Myeloperoxidase concentration (A) was assessed by ELISA. (B) Western blot of COX2, pro-caspase-1, caspase-1 p10, and cyclin D1 was performed with colonic mucosa samples. Band intensities of COX2 (C), pro-caspase-1 (D), caspase-1 p10 (E), and cyclin D1 (F) were quantified by densitometry, adjusted to that of β-actin, an endogenous control, and normalized to the mean value of 6w.M.C group. Box and whiskers (Turkey): the central line on each box, median; the edges of boxes, 25th and 75th percentiles; whiskers, maximum and minimum values of the data. p-Values to Kruskal–Wallis test are designated on the figure; ∗p < 0.05 according to Mann–Whitney U-test with Holm–Bonferroni correction. 6w, 6-week-old; 2yr, 2-year-old; M, male; F, female; C, control; HF, high-fat diet.