Department of Internal Medicine, Seoul National University Bundang Hospital, Seongnam, Gyeonggi-do, South Korea.
Department of Internal Medicine, Seoul National University Bundang Hospital, Seongnam, Gyeonggi-do, South Korea. nakim49@snu.ac.kr.
Department of Internal Medicine and Liver Research Institute, Seoul National University College of Medicine, Seoul, South Korea. nakim49@snu.ac.kr.
Department of Internal Medicine and Liver Research Institute, Seoul National University College of Medicine, Seoul, South Korea.
Department of Biological Sciences and Institute of Microbiology, Seoul National University, Seoul, South Korea.
Korea Institute of Science and Technology Natural Products Research Institute, Gangneung, South Korea.
Abstract
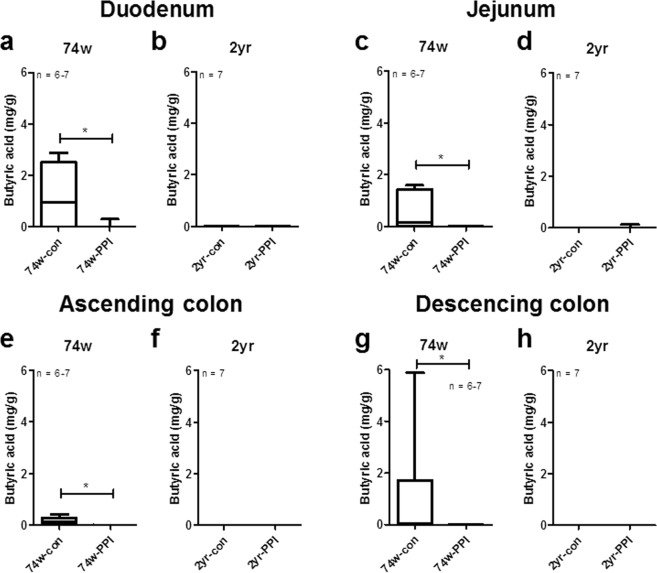
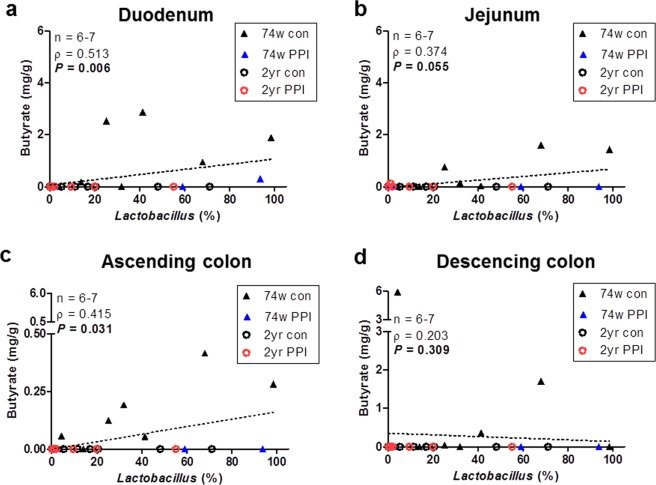
The association between adverse effects of PPI and gut microbiota in old age has yet to be elucidated. We assessed changes in the gut microbiota and butyrate levels following the long-term administration of PPIs to old rats and investigated their associations. F344 aged male rats were fed a PPI-supplemented diet for 50 weeks. The ileal microbiota was analysed by metagenomic sequencing of the 16S rRNA, while the butyrate concentration was measured by high-performance liquid chromatography. We observed a significant decrease in microbial diversity following PPI administration in the 2-year-old rats but not in the 74-week-old rats. PPI treatment reduced both commensal bacteria and opportunistic pathogens, particularly in the 2-year-old rats. Enterotypes comprising the majority of the control samples were enriched in Lactobacillus, while other enterotypes in the PPI group were dominated by Turicibacter or Romboutsia. The PPI treatment reduced the butyrate concentrations in the intestines and colons of 74-week-old rats compared to the control group. The abundance of Lactobacillus significantly correlated with butyrate concentrations in 74-week-old rats. In conclusion, long-term administration of PPIs alters the gut microbiota and butyrate concentrations in rats, particularly in old age, which may be an underlying mechanism of PPI-induced adverse effects such as pseudomembranous colitis.
Figures
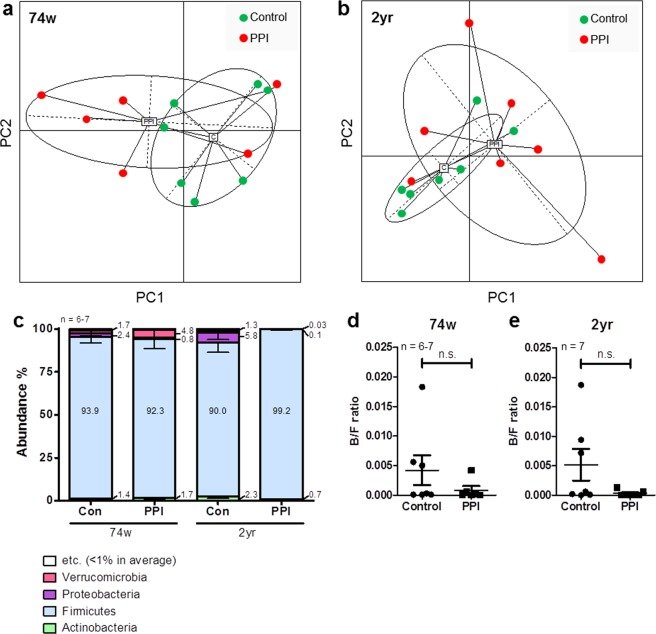
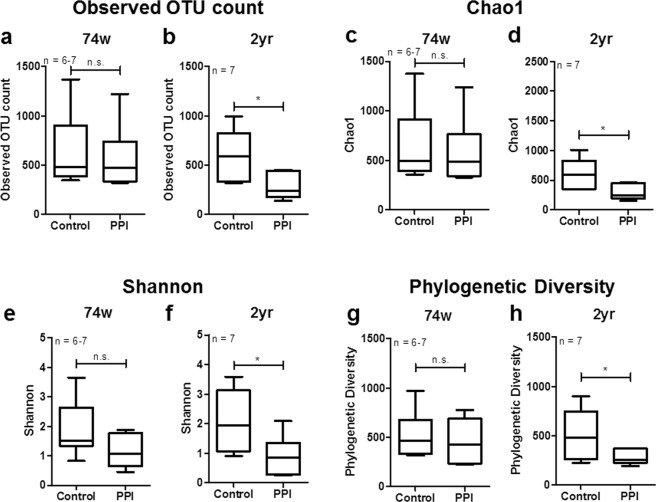
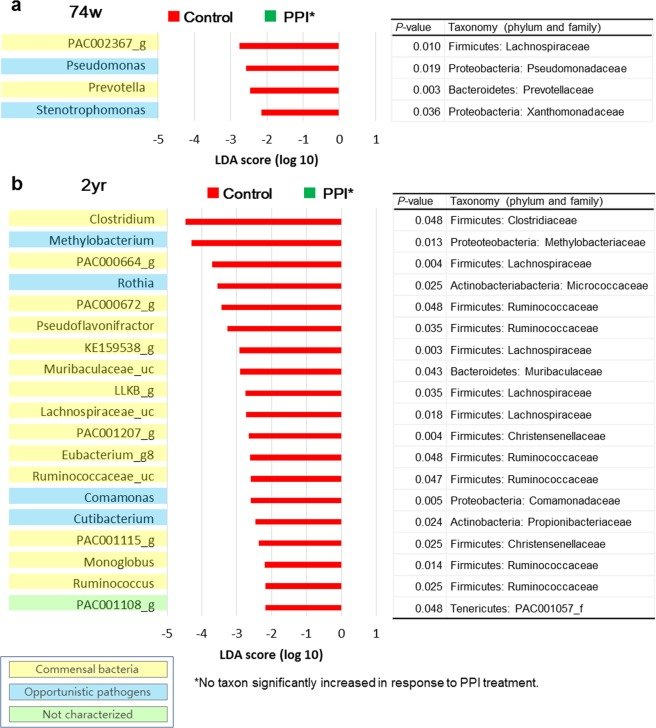
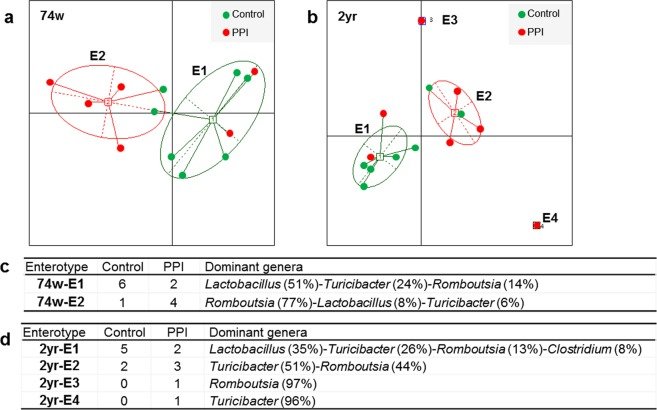
Figure 1Sample clustering and phylum compositions. Clustering of samples of (a) 74-week-old and (b) 2-year-old rats by principal coordinates analysis (PCoA). (c) Taxonomic composition at the phylum level. Microbial composition of ileal contents from the control or PPI-administered 74-week-old and 2-year-old rats. Bacteroidetes/Firmicutes ratio of (d) 74-week-old and (e) 2-year-old rats. Data are expressed as the median, Q1 (25%), and Q3 (75%). Whiskers show the minimum and maximum values. PPI, proton pump inhibitor; n.s., not significant.Figure 2Alpha diversity of gut microbiota. (a,b) Observed OTU count, (c,d) species richness (Chao1), (e,f) alpha diversity (Shannon), and (g,h) phylogenetic diversity of the gut microbiomes of (a,c,e,g) 74-week-old and (b,d,f,h) 2-year-old rats. Data are expressed as the median, Q1 (25%), and Q3 (75%). Whiskers show the minimum and maximum values. The P-values for the Wilcoxon rank-sum test are shown in the figure; *P < 0.05 according to a Wilcoxon rank-sum test. PPI, proton pump inhibitor; n.s., not significant.Figure 3PPI-dependent alterations in the microbiota composition: linear discriminant analysis (LDA) effect size (LEfSe) analysis. Bar plots of genera with significant differences in abundance with LEfSe analysis in (a) 74-week-old (b) 2-year-old rats. Red bars show the LDA scores of genera that decreased by PPI treatment. No taxon significantly increased in response to PPI treatment, which was to be indicated with a green bar. Each colour on the genus name indicates the characteristics of each genus: yellow for commensal bacteria, blue for opportunistic pathogens, and green for not characterized bacteria. P-values were determined with the non-parametric factorial Kruskal-Wallis (KW) sum-rank test. The ‘Taxonomy (phylum and family)’ columns show the taxonomy of each taxon at the level of phylum and family. PPI, proton pump inhibitor; 74w, 74-week-old; 2 yr, 2-year-old.Figure 4Enterotype clustering. (a) Two enterotypes (74w-E1, 2) of 74-week-old rat samples and (b) four enterotypes (2yr-E1, 2, 3, 4) of 2-year-old rat samples. The optimal cluster number was determined by maximizing the Calinski-Harabasz (CH) index value (Supplementary Fig. 3). The tables show the predominant genera in each enterotype of (c) 74-week-old and (d) 2-year-old rat samples. PPI, proton pump inhibitor.Figure 5Concentration of butyrate in the duodenum, jejunum, ascending colon (AC) and descending colon (DC). Concentration (mg/g) of butyrate in the (a,b) duodenum, (c,d) jejunum, (e,f) AC and (g,h) DC of 74-week-old and 2-year-old rats. Data are expressed as median and range; *P < 0.05 according to a Wilcoxon rank-sum test. Con, control; PPI, proton pump inhibitor; 74w, 74-week-old; 2 yr, 2-year-old.Figure 6Correlations between abundance ratio (%) of Lactobacillus in ileum luminal contents and concentrations of butyrate in four intestinal regions. Correlations between the abundance of Lactobacillus (%) and butyrate concentrations in the (a) duodenum, (b) jejunum, (c) ascending colon, and (d) descending colon. Dotted line indicates the regression line. Spearman’s rho values and P-values were determined with the Spearman’s rank correlation coefficient method.