
J Med Internet Res. 2020;22(5):e16443.
Detection of Atrial Fibrillation Using a Ring-Type Wearable Device (CardioTracker) and Deep Learning Analysis of Photoplethysmography Signals: Prospective Observational Proof-of-Concept Study.
제1저자 권순일, 홍준기 · 교신저자 최의근
소속 (4)
- Seoul National University Hospital, Seoul, Republic of Korea.
- Department of Electrical Engineering, Korea Advanced Institute of Science and Technology, Daejeon, Republic of Korea.
- Sky Labs Inc, Seongnam, Republic of Korea.
- Department of Information and Communication Engineering, Hanbat National University, Daejeon, Republic of Korea.
Abstract
BACKGROUND Continuous photoplethysmography (PPG) monitoring with a wearable device may aid the early detection of atrial fibrillation (AF).
OBJECTIVE We aimed to evaluate the diagnostic performance of a ring-type wearable device (CardioTracker, CART), which can detect AF using deep learning analysis of PPG signals.
METHODS Patients with persistent AF who underwent cardioversion were recruited prospectively. We recorded PPG signals at the finger with CART and a conventional pulse oximeter before and after cardioversion over a period of 15 min (each instrument). Cardiologists validated the PPG rhythms with simultaneous single-lead electrocardiography. The PPG data were transmitted to a smartphone wirelessly and analyzed with a deep learning algorithm. We also validated the deep learning algorithm in 20 healthy subjects with sinus rhythm (SR).
RESULTS In 100 study participants, CART generated a total of 13,038 30-s PPG samples (5850 for SR and 7188 for AF). Using the deep learning algorithm, the diagnostic accuracy, sensitivity, specificity, positive-predictive value, and negative-predictive value were 96.9%, 99.0%, 94.3%, 95.6%, and 98.7%, respectively. Although the diagnostic accuracy decreased with shorter sample lengths, the accuracy was maintained at 94.7% with 10-s measurements. For SR, the specificity decreased with higher variability of peak-to-peak intervals. However, for AF, CART maintained consistent sensitivity regardless of variability. Pulse rates had a lower impact on sensitivity than on specificity. The performance of CART was comparable to that of the conventional device when using a proper threshold. External validation showed that 94.99% (16,529/17,400) of the PPG samples from the control group were correctly identified with SR.
CONCLUSIONS A ring-type wearable device with deep learning analysis of PPG signals could accurately diagnose AF without relying on electrocardiography. With this device, continuous monitoring for AF may be promising in high-risk populations.
TRIAL REGISTRATION ClinicalTrials.gov NCT04023188; https://clinicaltrials.gov/ct2/show/NCT04023188.
©Soonil Kwon, Joonki Hong, Eue-Keun Choi, Byunghwan Lee, Changhyun Baik, Euijae Lee, Eui-Rim Jeong, Bon-Kwon Koo, Seil Oh, Yung Yi. Originally published in the Journal of Medical Internet Research (http://www.jmir.org), 21.05.2020.
Keywords
atrial fibrillationdeep learningdiagnosisphotoplethysmographywearable electronic devices
Figures

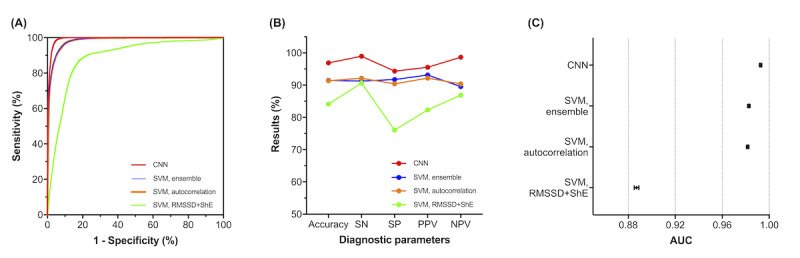


그림 출처: PubMed Central 공개 논문 (PMC7273241)
Conflict of interest statement
Conflicts of Interest: SK, JH, EL, and SO: None declared. EKC, ERJ, BKK, and YY: Stockholders of Sky Labs Inc, Seongnam, Republic of Korea. BL and CB: Employees of Sky Labs Inc.
그 밖의 정보
- 출판 형태
- Journal Article, Research Support, Non-U.S. Gov't
- 저널
- Journal of medical Internet research · eISSN 1438-8871
- 전자 출판
- 2020-05-21
- MeSH
- Atrial Fibrillation / diagnosis · Deep Learning / standards · Female · Humans · Male · Middle Aged · Photoplethysmography / methods · Proof of Concept Study · Prospective Studies · Wearable Electronic Devices / standards
- 데이터
- ClinicalTrials.gov: NCT04023188
- 참고문헌
- 31편