Biomedical Research Institute, Seoul National University Hospital, Seoul, Republic of Korea.
Molecular Medicine & Biopharmaceutical Sciences, Seoul National University, Seoul, Republic of Korea.
Korean Medical Science Research Center for Healthy-Aging, Graduate Training Program of Korean Medicine for Healthy-Aging, Pusan National University, Yangsan, Republic of Korea.
Division of Genome Application, Macrogen, Inc., Seoul, Republic of Korea.
Department of Internal Medicine, Hanyang University School of Medicine, Seoul, Republic of Korea.
Department of Pathology, Seoul National University College of Medicine, Seoul, Republic of Korea.
Department of Internal Medicine, Seoul National University College of Medicine, Seoul, Republic of Korea.
Abstract
Transforming growth factor β (TGFβ) is a crucial factor in fibrosis, and transcriptional intermediary factor 1γ (TIF1γ) is a negative regulator of the TGFβ pathway; however, its role in liver fibrosis is unknown. In this study, mesenchymal stem cells derived from human embryonic stem cells (hE-MSCs) that secrete hepatocyte growth factor (HGF) were used to observe the repair of thioacetamide (TAA)-induced liver fibrosis. Our results showed that TIF1γ was significantly decreased in LX2 cells when exposed to TGFβ1. Such decrease of TIF1γ was significantly prevented by co-culture with hE-MSCs. Interaction of TIF1γ with SMAD2/3 and binding to the promoter of the α-smooth muscle gene (αSMA) suppressed αSMA expression. Phosphorylation of cAMP response element-binding protein (CREB) and binding on the TIF1γ promoter region induced TIF1γ expression. Furthermore, hepatic stellate cell-specific TIF1γ-knockout mice showed aggravation of liver fibrosis. In conclusion, loss of TIF1γ aggravates fibrosis, suggesting that a strategy to maintain TIF1γ during liver injury would be a promising therapeutic approach to prevent or reverse liver fibrosis.
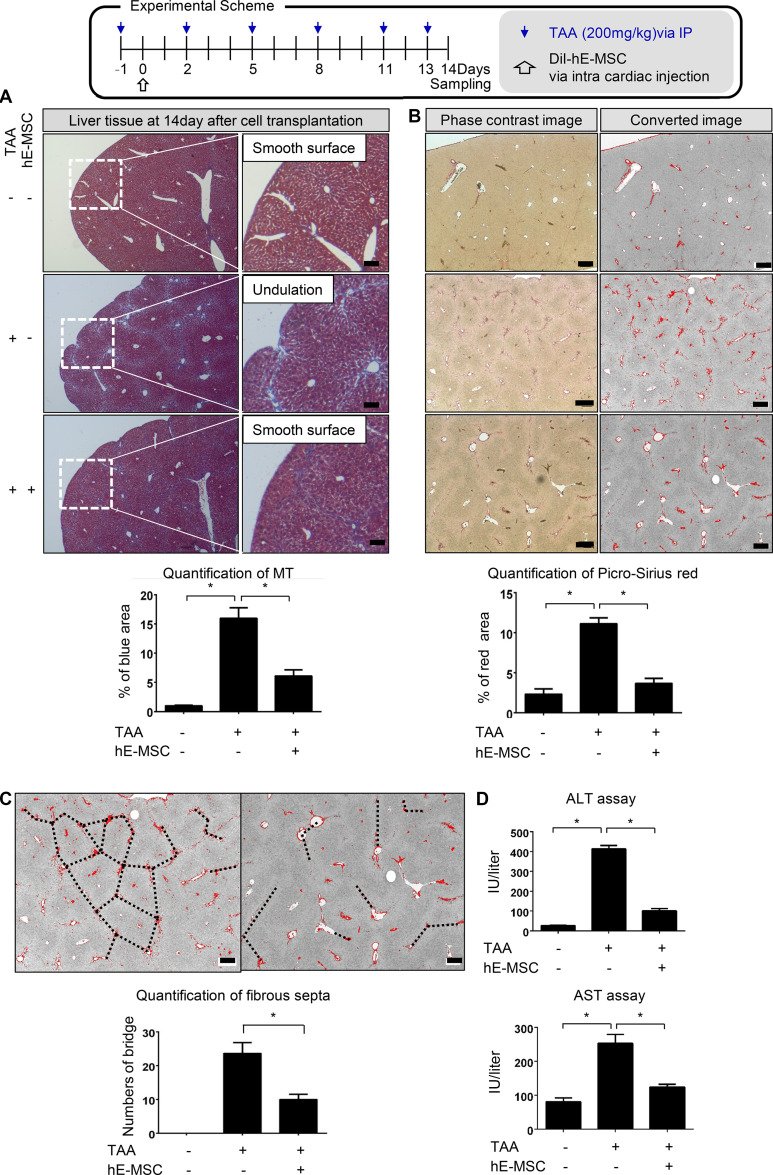
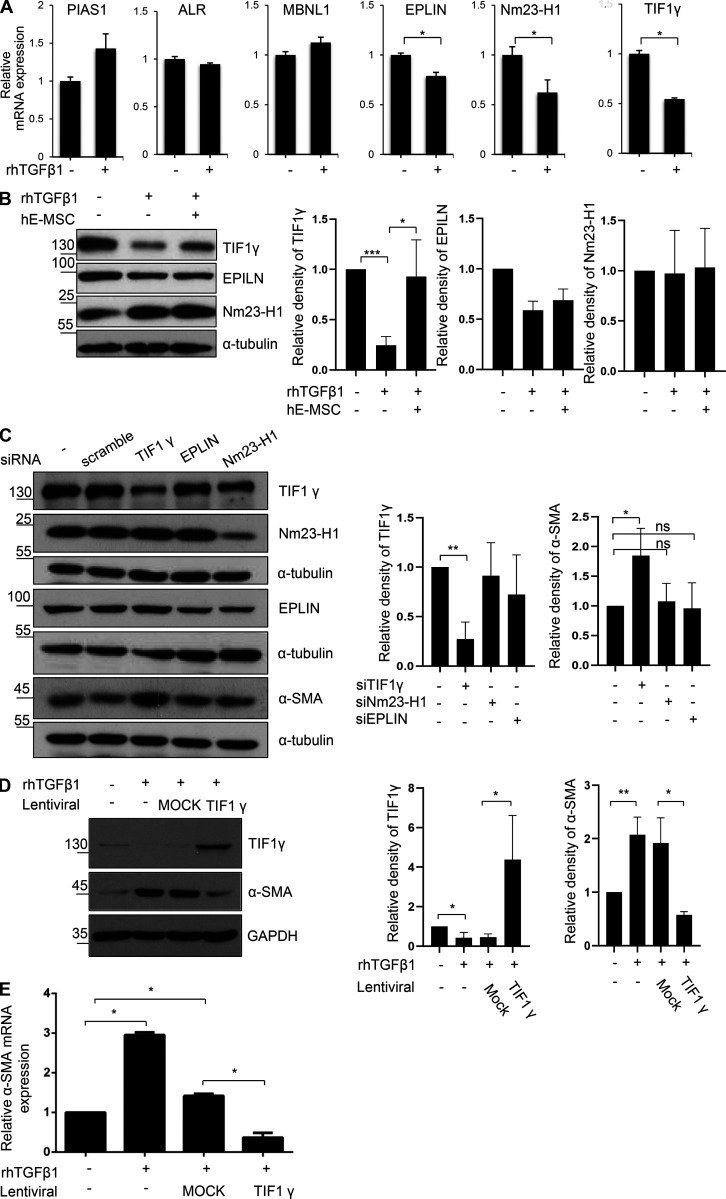
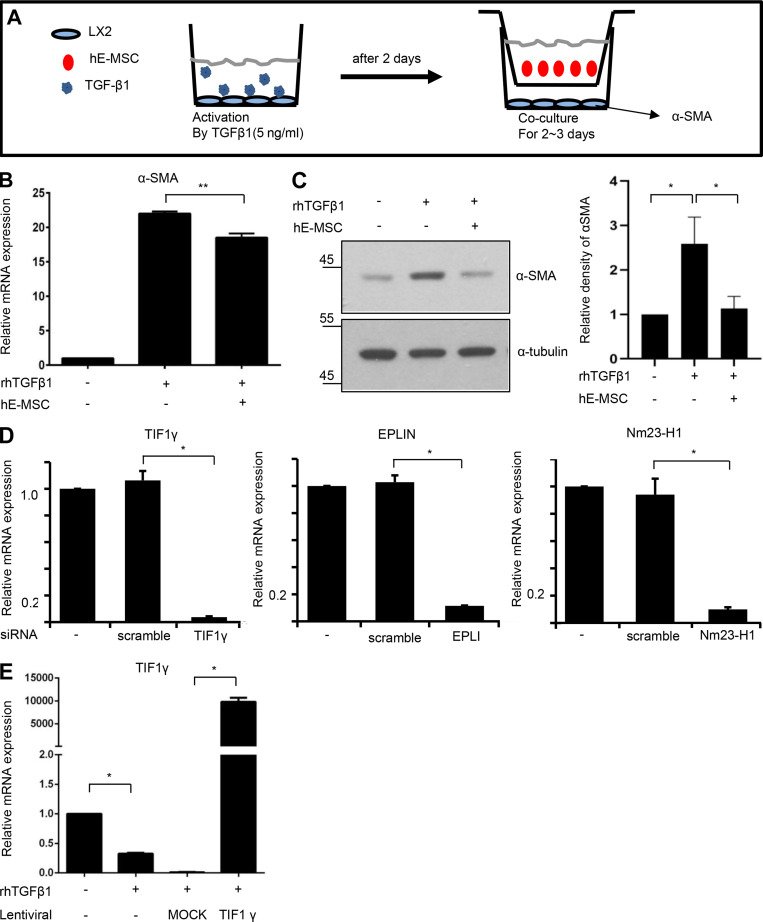
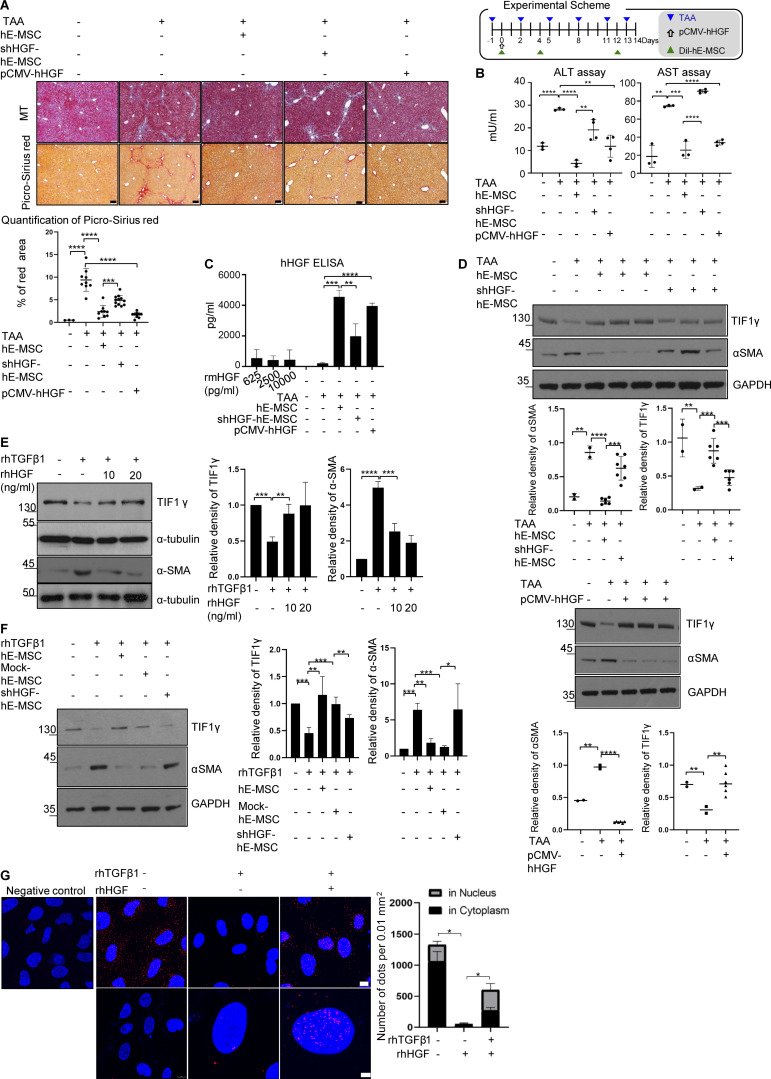
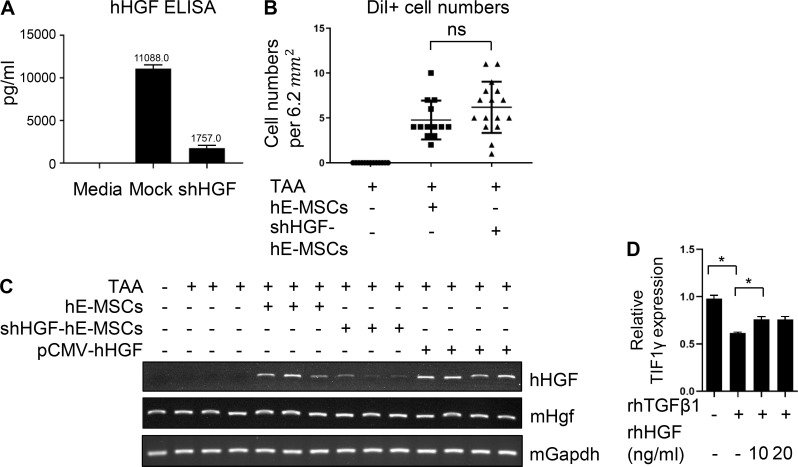
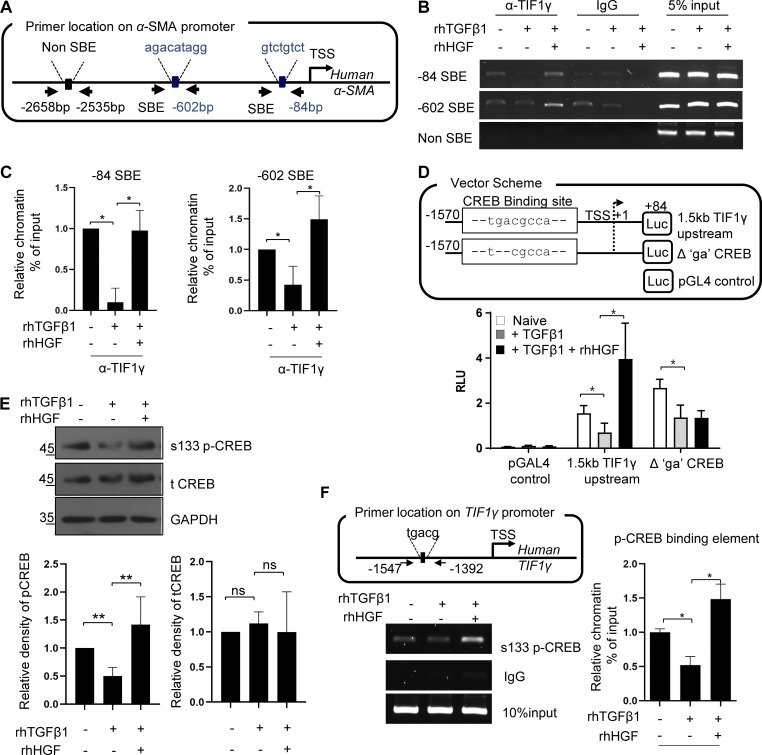
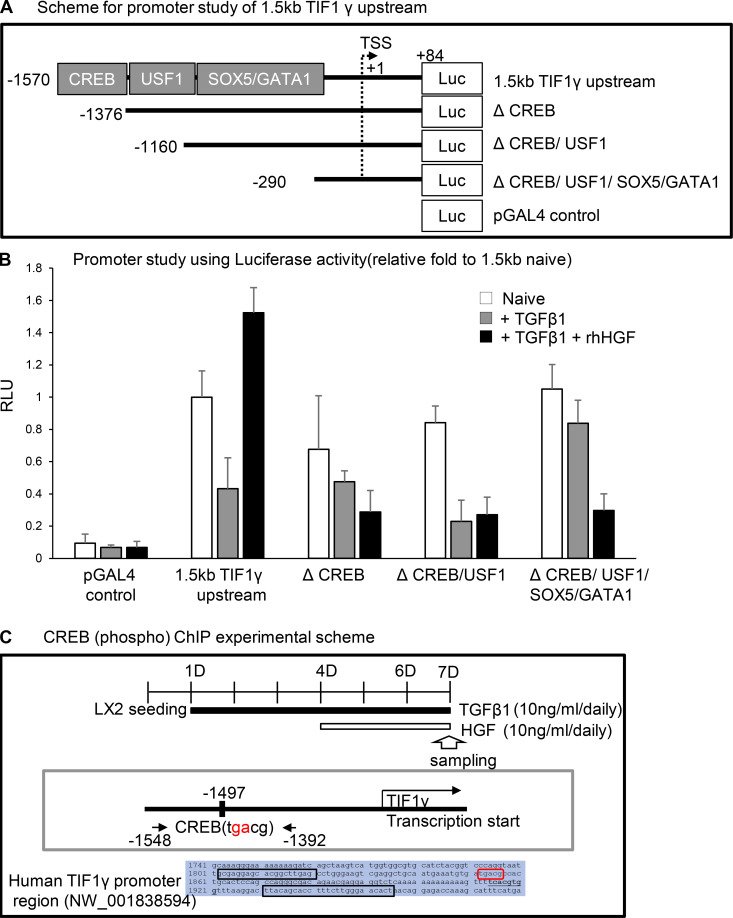
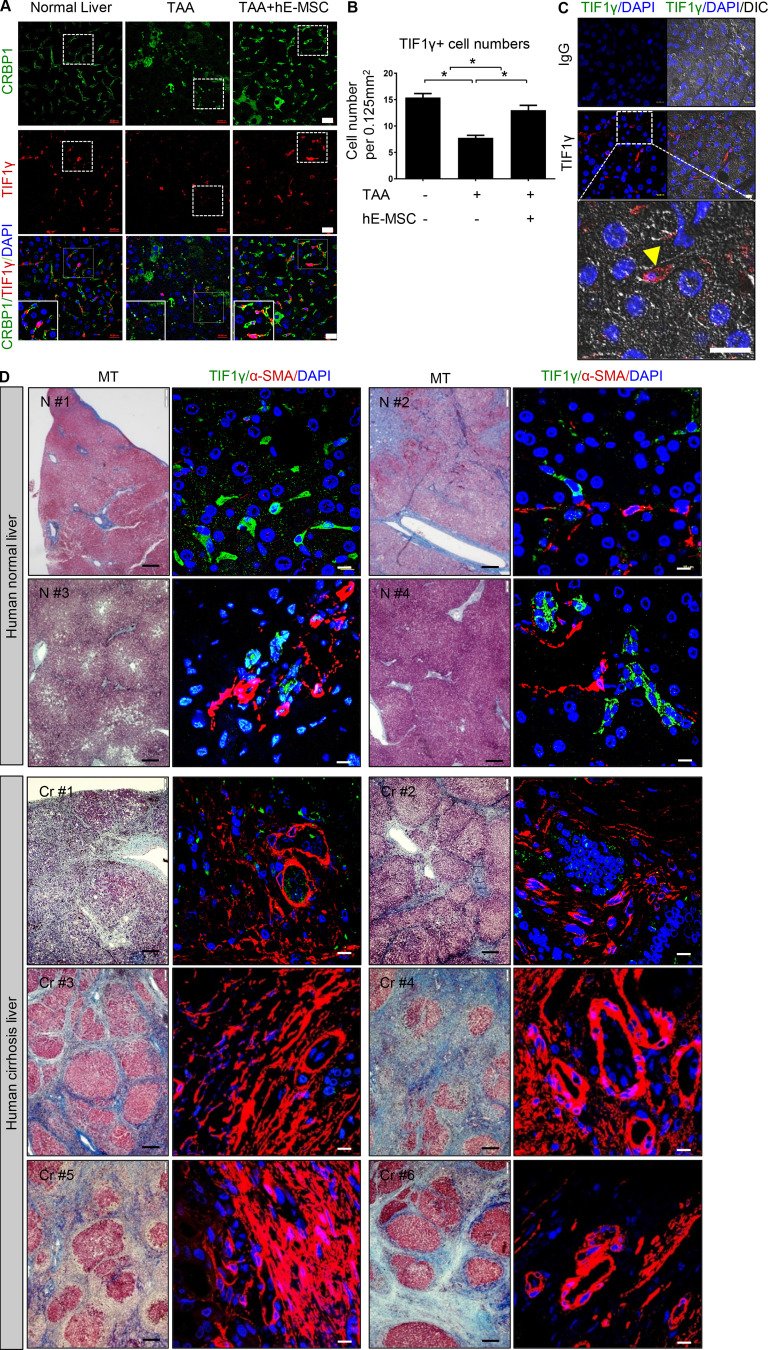
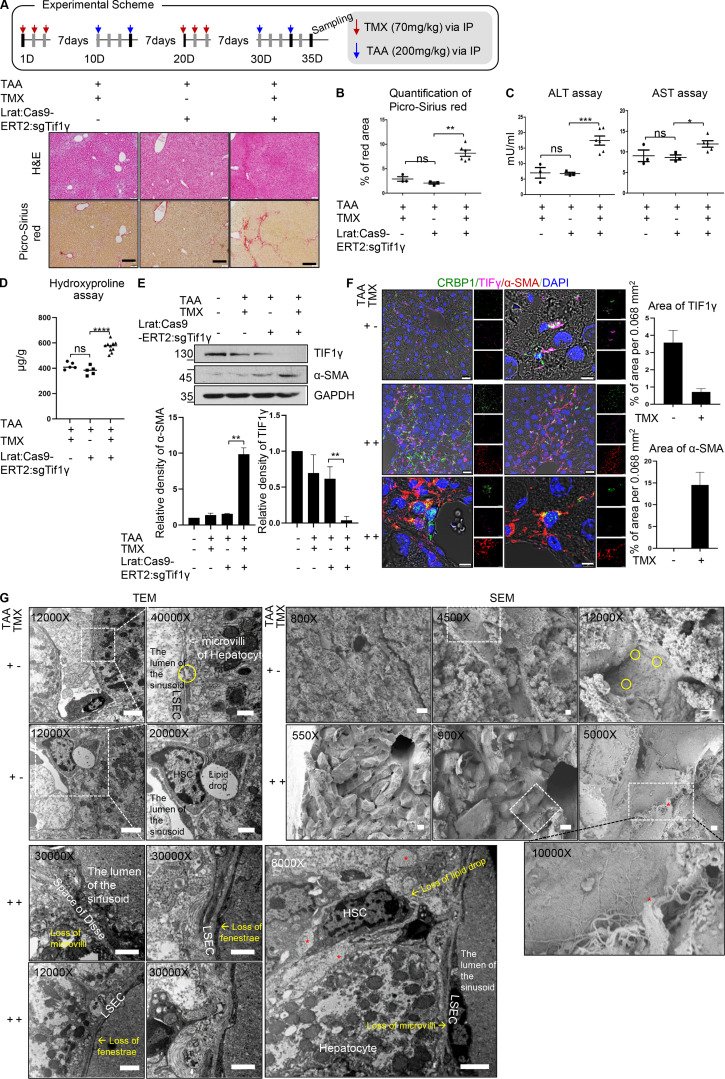
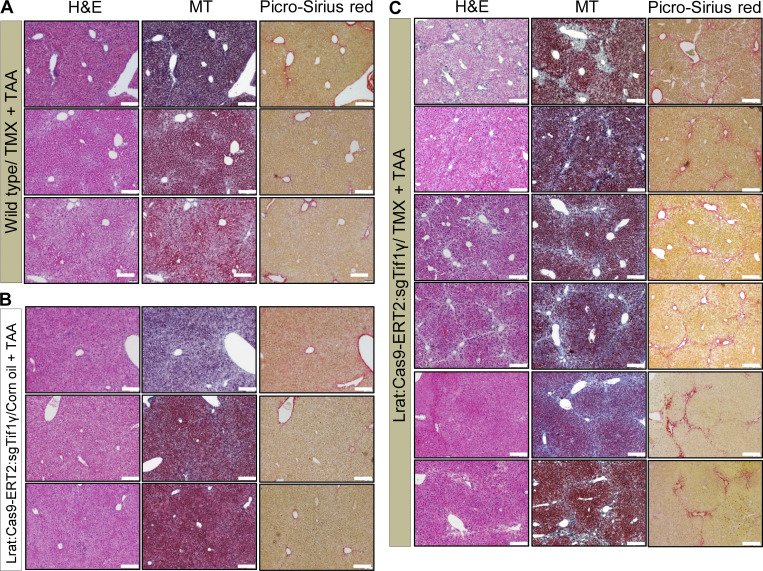
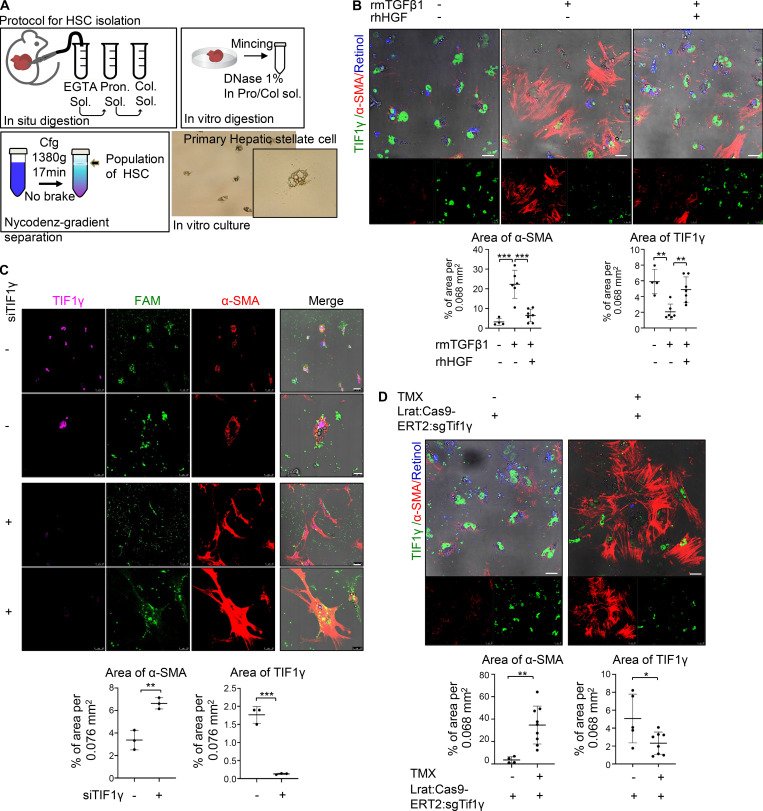
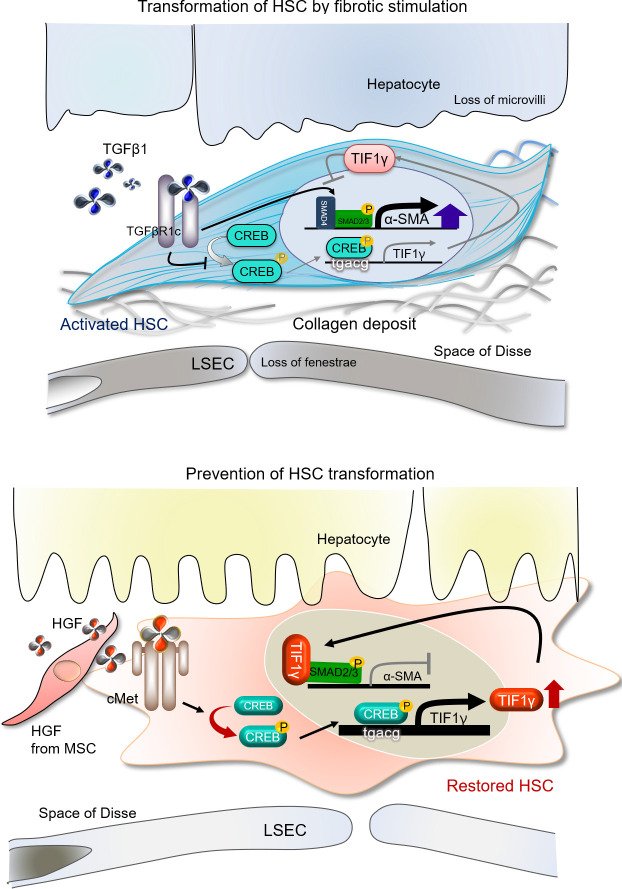
Figure 1.hE-MSC transplantation represses liver fibrosis after injury in mice.(A) Experimental scheme of hE-MSC transplantation into mice having a liver injury by TAA administration. Quantification of liver fibrosis by MT staining in three groups (normal, TAA, and TAA/hE-MSCs; mice, n = 5 in each group, compiled from two independent experiments). Quantification of the fibrotic area is presented as the blue portion (%) in total area, including red and blue portions. *, P < 0.05. Scale bars, 200 µm. IP, immunoprecipitation. (B) Picro-Sirius red staining of fibrotic areas in the livers at 14 d after hE-MSC transplantation. Quantification of liver fibrosis by Picro-Sirius red staining in three groups (normal, TAA, and TAA/hE-MSCs; mice, n = 5 in each group, compiled from two independent experiments). *, P < 0.05. Scale bars, 200 µm. (C) Measurement of fibrous septa using Picro-Sirius red staining. Portal-to-portal fibrous bridging/septa were counted per 2.7 × 3.4 mm2 (TAA vs. TAA/hE-MSCs; n = 5). Scale bars, 200 µm. Data are expressed as the mean ± SD. *, P < 0.05. (D) Serum levels of hepatotoxicity indicators AST and ALT at 14 d (normal, TAA, and TAA/hE-MSCs; mice, n = 5 in each group, compiled from two independent experiments). Statistical analysis by one-way ANOVA (A, B, and D) or unpaired Student's t test (C).Figure 2.TIF1γ is a repressor for myofibroblastic activation of human hepatic stellate LX2 cells.(A) RT-qPCR analysis of six genes after TGFβ1 treatment. *, P < 0.05 (unpaired Student's t test). Mean values ± SD were calculated from three independent experiments, with biological triplicates in each experiment. (B) Representative Western blot of TIF1γ, EPLIN, and Nm23-H1 expression in TGFβ1-treated LX2 cells with or without hE-MSCs (quantified by ImageJ). Reproducible results from three independent experiments are shown. Mean values ± SD were calculated from three independent experiments, with biological triplicates in each experiment. *, P < 0.05; ***, P < 0.0001. (C) Representative Western blot of TIF1γ, EPLIN, and Nm23-H1, and αSMA expression in LX2 cells transfected with siEPLIN, siNm23-H1, or siTIF1γ for gene knockdown (quantified by ImageJ). Reproducible results from three independent experiments are shown. Mean values ± SD were calculated from three independent experiments, with biological triple in each experiment. *, P < 0.05; **, P < 0.01. (D) Representative Western blot of TIF1γ and αSMA expression in TGFβ1-treated LX2 cells transduced by lentiviral vector CMV-TIF1γ (quantified by ImageJ). Results represent the mean ± SD of three independent biological experiments. *, P < 0.05; **, P < 0.01. (E) RT-qPCR analysis of αSMA gene in TGFβ1-treated LX2 cells transduced by lentiviral vector CMV-TIF1γ. *, P < 0.05. Results represent the mean ± SD of three independent experiments, with biological triplicates in each experiments. Statistical analysis was performed by one-way ANOVA. ns, not significant.Figure S1.The process for selection ofTIF1γusing in vitro cell system. (A) Experimental scheme for validation of anti-fibrosis potential of hE-MSCs in vitro. (B) RT-qPCR analysis of αSMA expression. Results represent the mean ± SD of three independent biological experiments. **, P < 0.01. (C) Western blot analysis of αSMA protein expression. Quantified by ImageJ. Results represent the mean ± SD of three independent biological experiments. *, P < 0.05. (D) RT-qPCR analysis for the validation of knockdown by siRNA. Results represent the mean ± SD of three independent experiments. *, P < 0.05. (E) RT-qPCR analysis for validation of TIF1γ overexpression by lentiviral vector. Results represent the mean ± SD of three independent experiments. *, P < 0.05.Figure 3.Induction of TIF1γ by HGF and complex formation with SMAD.(A) Experimental scheme of hE-MSC or shHGF hE-MSCs or pCMV-hHGF vector transplantation into mice with a liver injury by TAA administration. Representative histochemical staining of MT and Picro-Sirius red staining in each group (each panel from an independent individual). Quantification of liver fibrosis by Picro-Sirius red staining in five groups (normal, TAA and TAA/hE-MSCs, TAA/shHGF hE-MSCs, and TAA/pCMV-hHGF; n = 3, 5, 5, 5, and 5, respectively) is presented as the red portion (%) in total area. One or two fields in each sample were measured using ImageJ. Mean values ± SD were calculated from measured fields of each sample in each group. Scale bars, 10 µm. ***, P < 0.001; ****, P < 0.0001. (B) Serum levels of hepatotoxicity indicators AST and ALT at 14 d (normal, TAA and TAA/hE-MSCs, TAA/shHGF hE-MSCs, TAA/pCMV-hHGF. n = 3, 3, 3, 4, and 4, respectively). Mean values ± SD were calculated from three or four samples with technical duplicates in each sample. **, P < 0.01. ***, P < 0.001; ****, P < 0.0001. (C) ELISA of hHGF in mouse serum (normal, TAA and TAA/hE-MSCs, TAA/shHGF hE-MSCs, TAA/pCMV-hHGF; n = 3, 3, 3, 4, and 4, respectively). Recombinant mHGF was used as a negative control (625, 2,500, and 10,000 pg/ml) and did not show reactivity with hHGF antibody. hHGF antibody (AF-294-NA; R&D Systems) was used in ELISA reactive with hHGF, but not mHGF. Mean values ± SD were calculated from three or four samples with technical duplicates in each sample. **, P < 0.01; ***, P < 0.001; ****, P < 0.0001. (D) Representative Western blot of TIF1γ and αSMA expression in five groups (normal, TAA and TAA/hE-MSCs, TAA/shHGF hE-MSCs, and TAA/pCMV-hHGF). Each lane represents one independent individual. Reproducible results from two independent Western blots are shown (quantified by ImageJ). Mean values ± SD were calculated from two or six bands in two independent Western blots. **, P < 0.01; ***, P < 0.001; ****, P < 0.0001. (E) Representative Western blot for TIF1γ and αSMA in LX2 cells treated with rhTGF β1 (5 ng/ml) and/or rhHGF (10 or 20 ng/ml; quantified by ImageJ). Results represent the mean ± SD of two independent biological experiments. **, P < 0.01; ***, P < 0.001; ****, P < 0.0001. (F) Representative Western blot of TIF1γ and αSMA in LX2 co-cultured with shHGF- or mock-transfected hE-MSCs (quantified by ImageJ). Results represent the mean ± SD of two independent biological experiments. *, P < 0.05; **, P < 0.01; ***, P < 0.001. (G) Representative PLA to confirm interaction of TIF1γ and SMAD2/3 in LX2 cells. Rabbit TIF1γ antibody and mouse SMAD2/3 antibody were used. Anti-rabbit-plus and anti-mouse-minus probes bound to primary antibodies. Ligase was used to ligate the probes and polymerase used to amplify the specific sequence that could hybridize to the fluorescent probe to visualize interactions as dots. Red dots represent endogenous interactions between TIF1γ and SMAD2/3. The graph shows the total number of dots in the nucleus (gray) and cytoplasm (black). Dots were counted using ImageJ in four random fields per group. Mean values ± SD were calculated from four fields in two independent experiments, with biological duplicates in each experiments. *, P < 0.05. The number of total dots was compared by one-way ANOVA. Scale bars represent 10 µm (upper panel) and 2 µm (bottom panel).Figure S2.Validation for the expression of hHGF by hE-MSC or shHGF or pCMV-hHGF in vivo and in vitro.(A) Validation of shHGF hE-MSCs using ELISA of hHGF. Results represent the mean ± SD of two independent experiments. (B) Counting of DiI-labeled hE-MSCs in liver tissue. Three or four randomized fields (6.2 mm2) were counted using immunofluorescence (TAA/hE-MSCs and TAA/shHGF hE-MSCs; n = 5 and 5, respectively; three TAA individual tissues used negative control). (C) RT-PCR of hHGF in mouse liver tissues. Using specific hHGF primers or mHgf primers, mRNA of hHGF or mHgf in mouse liver was detected. Each lanes were presented each individual mouse liver tissue. (D) RT-qPCR of TIF1γ in human HSCs and LX2 cells treated with hTGFβ1 (5 ng/ml) and/or hHGF (10 or 20 ng/ml). Results represent the mean ± SD of two independent experiments. *, P < 0.05. ns, not significant.Figure 4.Interaction of TIF1γ with SMAD and binding to the promoter of the αSMAsuppressed αSMA expression, and binding of pCREB on the TIF1γpromoter region induced TIF1γ expression.(A) Diagram showing the location of primers in αSMA promoter that can amplify each SBE. TSS, transcription start site. (B) Representative ChIP analysis of the αSMA promoter region with TIF1γ antibody and specific primers. The SBE sequence was analyzed using GPminer v. 2.0. TIF1γ antibody was used to pull down the protein–DNA complex, and the precipitated DNA fragments were analyzed with specific primers (indicated in the diagram) to confirm the binding sites. (C) Quantification of ChIP data. Results represent the mean ± SD of three independent biological experiments. *, P < 0.05. Statistically analyzed by one-way ANOVA. (D) Identification of CREB-binding sites in the putative promoter region (∼1.5 kb) of TIF1γ. Luciferase assay of a CREB-site point-mutated fragment (deletion of GA in TGACGCCA), evaluated using TGFβ1 and/or HGF. Results represent the mean ± SD of three independent biological experiments. *, P < 0.05 (one-way ANOVA). RLU, renilla luciferase unit. (E) Representative Western blot for total CREB and pCREBs133 in LX2 cells treated with TGFβ1 and/or HGF. Results represent the mean ± SD of three independent experiments. **, P < 0.01. (F) ChIP using primers for the CREB-binding site in the TIF1γpromoter, with the pCREBs133 antibody. Results represent the mean ± SD of three independent experiments. *, P < 0.05 (one-way ANOVA). ns, not significant.Figure S3.The screening and analysis of transcription factor on TIF1γ promoter.(A) Scheme of the promoter study of TIF1γ. (B) Promoter study by measuring luciferase reporter activity. Reproducible results from two independent experiments are shown. RLU, renilla luciferase unit. (C) Experimental setup for CREB (phospho) ChIP. To detect the CREB-binding site at residue 1,497, PCR was performed with CREB 1,548 5′-GCGAGGAGCACGGCTTGAG-3′ (forward) and CREB 1,392 5′-AGTGTTCCCAAGAAAGGTGCTGTAA-3′ (reverse) primers after chromatin pull-down with antibody against phosphorylated (Ser133) CREB.Figure S4.The expression of TIF1γ in normal mouse liver or HSC, and validation for development of TG mice with tamoxifen-inducible and HSC-specific knockout ofTif1γ.(A) TIF1γ expression in mouse liver analyzed by immunofluorescence. TIF1γ-positive cells were located in the space of Disse. Costaining of TIF1γ and CRBP1 (HSC marker) in mouse normal liver. Scale bars, 20 µm. The yellow arrowhead indicates the HSC in the space of Disse. (B) RT-qPCR of Tif1γ of primary HSC from normal and TAA-treated mouse liver tissues (BABL/c nude, n = 2; C57BL/6N, n = 4; technical triplicate). **, P < 0.01; ***, P < 0.001; ****, P < 0.0001. Dot shows replication. Statistical analysis was performed using one-way ANOVA. (C)Comparison between CRISPR/Cas9 and inducible Cas9. (D) Vectors and experimental setup used for the establishment of TMX-inducible Tif1γ–knockout TG mice. (E) Validation of working Cas9-ERT2 system using 293T cells transfected with the CMV-promoter-Cas9-ERT2 construct. Lamin A/C was used as a nuclear faction control and α-tubulin as a cytosolic faction control. Results represent the mean ± SD of three independent experiments. **, P < 0.01. (F) Representative Western blot validation of effective silencing by the Cas9-ERT2:sgTIF1γRNA system in LX2 cells transfected with Lrat:Cas9-ERT2: sgTIF1γRNA construct. Results represent the mean ± SD of three independent experiments. *, P < 0.05. (G) Immunofluorescence imaging analysis of the Cas9-ERT2/sgTIF1γ system in LX2 cells. Scale bar, 7.5 µm. Comparison of a transfected (region of interest [ROI] 1) and a nontransfected (ROI 2) cell after TMX. Reproducible results from two independent experiments are shown.Figure 5.TIF1γ expression in liver analyzed by immunofluorescence.(A) TIF1γ and CRBP1 staining in normal, TAA-treated, and hE-MSC–transplanted mouse livers after TAA treatment. Scale bars, 20 µm. (B) Quantification of TIF1γ-positive cells in the livers at 14 d (normal, TAA, and TAA/hE-MSCs; n = 3 in each group). TIF1γ-positive cells per 0.125 mm2 were counted using immunofluorescence images (n ≥ 4 for each slide). Mean values ± SD were calculated from counted fields of each sample in each group. (C) Immunofluorescence of TIF1γ in human normal liver. TIF1γ-positive cells (arrowhead) were located in the space of Disse. Scale bar, 10 µm. (D) TIF1γ and αSMA double staining in human normal (n = 4) and cirrhotic (n = 6) liver tissues. Human liver tissue was purchased from SuperBioChip Laboratories. Black scale bars, 20 µm; white scale bars, 10 µm.Figure 6.Confirmation of TG mice with TMX-inducible and HSC-specific knockout of Tif1γ. (A) Observation of fibrosis and bridging structures by Picro-Sirius red staining upon knockdown of TIF1γ. Representative histochemical staining of Picro-Sirius red and H&E in each group. There were three groups: TMX/TAA in wild-type (n = 3), corn oil/TAA in TG (n = 3), and TMX/TAA in TG (n = 6). Two experiments were performed. Scale bars, 20 µm. IP, immunoprecipitation; D, day. (B) Quantification of fibrosis using Picro-Sirius red staining images. Fibrosis region was measured using ImageJ (TMX/TAA in wild-type, n = 3; corn oil/TAA in TG, n = 3; TMX/TAA in TG, n = 6). Data are expressed as the mean ± SD. Differences between groups were analyzed by one-way ANOVA (lane 1 and 2, n = 3; lane 3, n = 6).**, P < 0.01. (C) Serum levels of AST and ALT at 35 d in the experimental scheme. AST was measured through absorbance of 450 nm, and ALT was detected through 570 nm (TMX/TAA in wild-type, n = 3; corn oil/TAA in TG, n = 3; TMX/TAA in TG, n = 6; two experiments). Data are expressed as the mean ± SD. Differences between groups were analyzed by one-way ANOVA (lane 1 and 2, n = 3; lane 3, n = 6). *, P < 0.05; ***, P < 0.001. (D) Hydroxyproline assay from liver tissues at 35 d in the experimental scheme. The hydrolyzed hydroxyproline from homogenized liver tissue was detected at 560-nm absorbance using GloMax (Promega) system (TMX/TAA in wild-type, n = 3; corn oil/TAA in TG, n = 3; TMX/TAA in TG, n = 6; each sample measured one or two times; one experiment). Differences between groups were analyzed by one-way ANOVA (lane 1 and 2, n = 5; lane 3, n = 10).****, P < 0.0001. (E and F) Representative Western blot analysis (E) andimmunofluorescence of TIF1γ and αSMA protein in livers at 35 d (F). CRBP1 used as a HSC marker in immunofluorescence (quantified by ImageJ). Results represent the mean ± SD of two independent biological experiments. Scale bars represent 25 µm for the 400× image (left, lower magnification) and 2 µm for the 2,000× image (right, higher magnification). **, P < 0.01. (G) Representative transmission and SEM images of TG mice liver after corn oil/TAA treatment at 35 d. The circles indicate fenestrae of LSECs. Asterisks indicate collagen deposits in the periphery of HSCs. Scale bars represent 2 µm for 12,000× magnification, 1 µm for 20,000× and 30,000× magnification, and 500 nm for 40,000× magnification in transmission electron microscopy images. Scale bars represent 10 µm for 550×, 800×, and 900× magnification and 1 µm for 4,500×, 5,000×, and 12,000× magnification. Reproducible results from two independent experiments are shown. ns, not significant.Figure S5.The observation of TG mice with tamoxifen-inducible and HSC-specific knockout ofTif1γ.(A) Wild-type mouse livers after TAA injury induced with TMX were stained with HE, MT, and Picro-Sirius red, demonstrating mild fibrosis. Scale bars, 20 µm. (B) Lrat:Cas9-ERT2:sgTif1γ-TG mouse livers after TAA injury induced with vehicle corn oil were stained with HE, MT, and Picro-Sirius red, demonstrating mild fibrosis, as observed in wild-type mice. Scale bars, 20 µm. (C) Lrat:Cas9-ERT2:sgTif1γ TG mouse livers after TAA injury induced with TMX were stained with HE, MT, and Picro-Sirius red. Scale bars, 20 µm. Supplementary data of Fig. 6 A, duplicated for clarity.Figure 7.Validation of TIF1γ effect in primary HSC. (A) Schematic drawing illustrating the procedure of preparation of primary HSCs. (B) Representative immunofluorescence staining of primary HSCs prepared from a C57BL6/N wild-type mouse. Reproducible results from two independent experiments are shown. The percent TIF1γ or αSMA-positive area per 0.068 mm2 was quantified using ImageJ. Scale bars, 25 µm. **, P < 0.01; ***, P < 0.001. (C) Representative immunofluorescence staining of wild-type HSCs transfected with TIF1γ siRNA for 3 d. Reproducible results from two independent experiments are shown. Percent TIF1γ or αSMA-positive area per 0.076 mm2 was quantified using ImageJ program. Scale bars represent 25 µm (low magnification) and 10 µm (high magnification). **, P < 0.01; ***, P < 0.001. (D) Representative immunofluorescence staining of HSCs from TG mouse. HSCs treated with 10 nM TMX for 4 d after HSC isolation from TG liver. Reproducible results from two independent experiments are shown. Percent TIF1γ or αSMA-positive area per 0.068 mm2 was quantified using ImageJ. Scale bars, 25 µm. *, P < 0.05; **, P < 0.01.Figure 8.Role of TIF1γ during HSC transformation and restoration. TIF1γ expression in HSCs is decreased by TGFβ1 and increased in the presence of HGF. Phosphorylation of CREB and binding of pCREB on the TIF1γ promoter region induced TIF1γ expression. Interaction of TIF1γ with SMAD2/3 and binding of the complex to the promoter of αSMA suppressed αSMA expression. Therefore, TIF1γ has potential in the development of new therapeutic approaches to inhibiting or treating liver fibrosis.
그림 출처: PubMed Central 공개 논문 (PMC7971140)
Conflict of interest statement
Disclosures: The authors declare no competing interests exist.
그 밖의 정보
출판 형태
Journal Article, Research Support, Non-U.S. Gov't
저널
The Journal of experimental medicine · eISSN 1540-9538