Department of Internal Medicine, 2 Department of Pathology, and 3 Department of Surgery, Seoul National University Hospital, Seoul 110-744, Korea.
Abstract
RNA editing can increase RNA sequence variation without altering the DNA sequence. By comparing whole-genome and transcriptome sequence data of a rectal cancer, we found novel tumor-associated increase of RNA editing in ras homologue family member Q (RHOQ) transcripts. The adenosine-to-inosine (A-to-I) editing results in substitution of asparagine with serine at residue 136. We observed a higher level of the RHOQ RNA editing in tumor compared with normal tissue in colorectal cancer (CRC). The degree of RNA editing was associated with RhoQ protein activity in CRC cancer cell lines. RhoQ N136S amino acid substitution increased RhoQ activity, actin cytoskeletal reorganization, and invasion potential. KRAS mutation further increased the invasion potential of RhoQ N136S in vitro. Among CRC patients, recurrence was more frequently observed in patients with tumors having edited RHOQ transcripts and mutations in the KRAS gene. In summary, we show that RNA editing is another mechanism of sequence alteration that contributes to CRC progression.
Figures
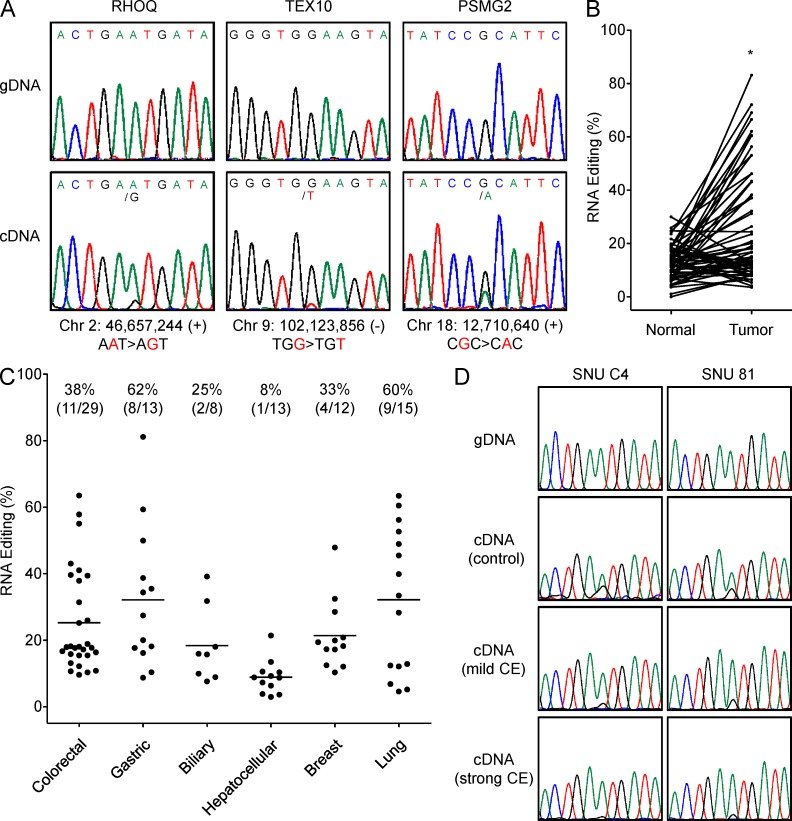
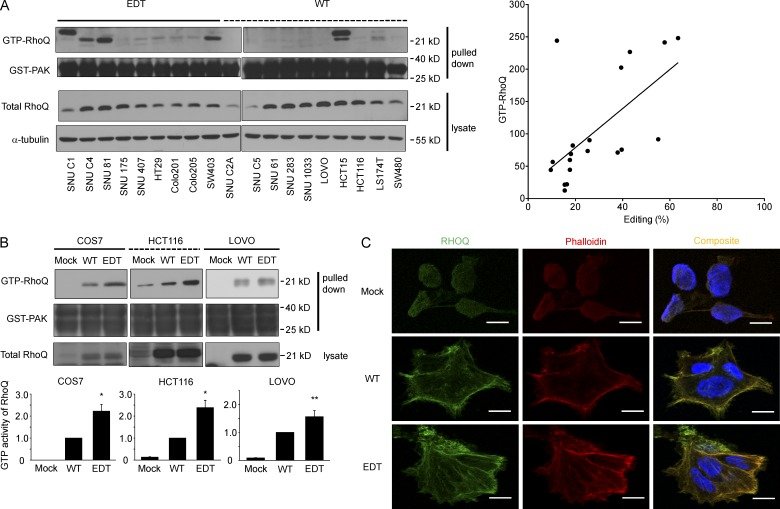
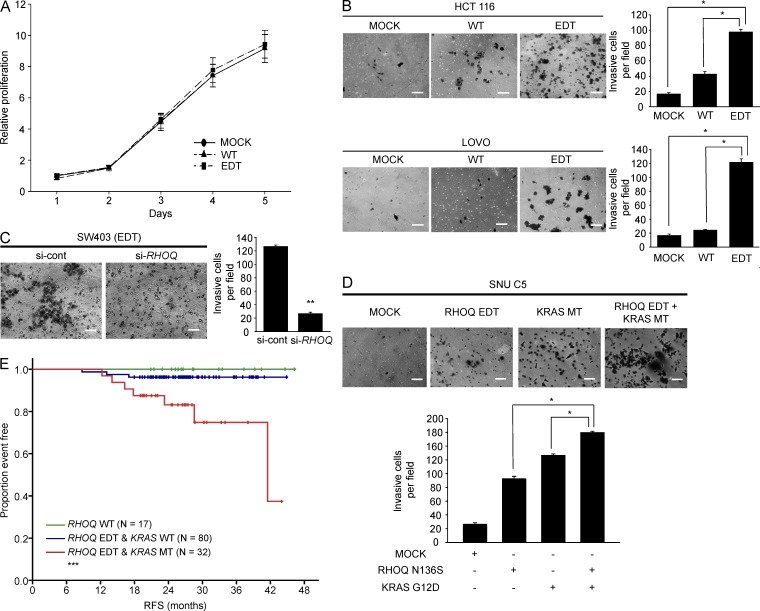
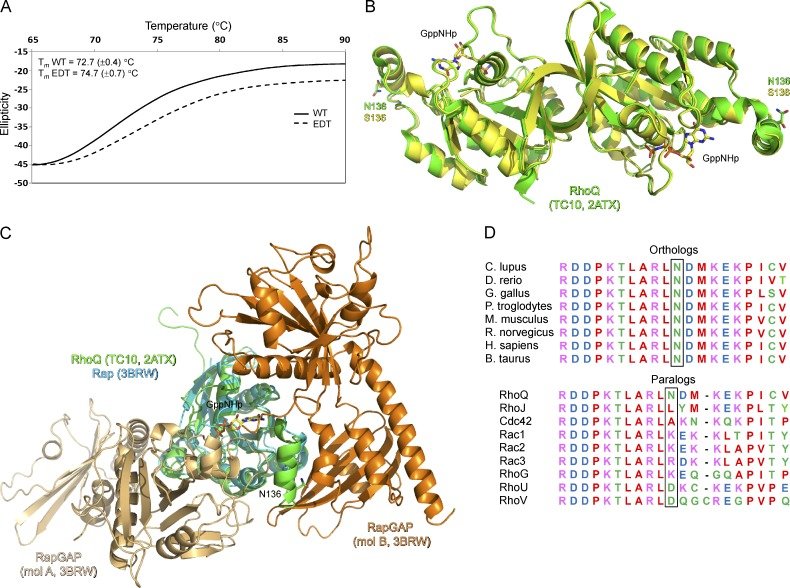
Figure 1.RHOQ RNA editing in CRC patients and cancer cell lines. (A) RNA editings of RHOQ (chr 2: 46,657,244; A-to-G), TEX10 (chr 9: 102,123,856; G-to-T), and PSMG2 (chr 18: 12,710,640; G-to-A) are validated in genomic DNA (top) and cDNA (bottom) by Sanger sequencing. (B) RHOQ RNA editing in 60 paired specimens of primary colorectal tumor and adjacent normal mucosa. The percentage of RNA editing was determined using pyrosequencing. The p-value was calculated by paired Student’s t test. (C) Percentage of RHOQ editing in the following cell lines: CRC (n = 29), gastric cancer (n = 13), biliary cancer (n = 8), HCC (n = 13), breast cancer (n = 1 2), and nonsmall cell lung cancer (n = 15). The percentages and the numbers in parentheses indicate the percentages and numbers of cell lines/total cell lines having RHOQ RNA editing using a cut-off of 20% edited sequence determined by pyrosequencing, respectively. (D) Top panels show chromatograms of regions amplified from gDNA in SNU C4 and SNU 81 cells. The bottom three sets of panels show the chromatograms of cDNAs amplified from total RNA under the following conditions: without cyanoethylation (control, 0 M acrylonitrile for 15 min), treated with mild conditions of cyanoethylation (mild CE, 1 mol/liter acrylonitrile for 15 min), or strong conditions of cyanoethylation (strong CE, 1 mol/liter acrylonitrile for 30 min). The G peaks resulting from A-to-I editing decreased in response to the strength of cyanoethylation. Data are representative of three independent experiments. *, P < 0.001.Figure 2.RHOQ RNA editing increases the GTP-bound form of RhoQ and regulates F-actin reorganization. (A) 19 human CRC cell lines were used for the RhoQ activity assay by in vitro GST-PAK1 (76–150) pull-down. Western blot analysis for GTP-RhoQ, GST-PAK, total RhoQ, and α-tubulin are shown for the indicated cells (left). Scatter plot with linear regression line showing amount of GTP-bound RhoQ measured by densitometer versus degree of editing (right; two independent reconstitution experiments). (B) COS7, HCT116, and LOVO cells were transiently transfected with WT RHOQ, N136S edited RHOQ (EDT), or empty vector control (Mock) and the activity of RhoQ was measured by the RhoQ activity assay after 48 h. Western blotting was performed for GTP-RhoQ, GST-PAK, and total RhoQ. Data represent the mean ± SD of three independent experiments. P-values were determined by Student’s t test comparing WT and EDT. (C) Stable RhoQ WT or RhoQ N136S (EDT)-expressing HCT116 cells were stained with rhodamine-phalloidin (red) to visualize F-actin and with antibodies to RhoQ (green) and Alexa Fluor 488–conjugated anti–mouse IgG to visualize RhoQ. Areas with overlapping actin (red) and RhoQ (green) staining are seen as yellow in the composite image. Bars, 20 µm. Data are representative of two independent experiments. *, P < 0.05; **, P = 0.069.Figure 3.RHOQ RNA editing enhances invasion potential. (A) HCT116 cells were transfected with WT RHOQ, N136S edited RHOQ (EDT), or empty vector control (Mock). The cell viabilities were measured via 3-(4,5-dimethylthiazol-2-yl)-2,5-diphenyltetrazolium bromide assays for 5 d. Data are representative of two independent experiments. (B) HCT116 and LOVO cells were transfected with the indicated plasmids for 72 h. Cell invasion was analyzed via Boyden chamber assay. Bars, 100 µm. Data represent the mean ± SD of three independent experiments. P-values were calculated by the Student’s t test. (C) SW403 cells expressing edited RHOQ were transfected with either RHOQ small interfering RNA (si-RHOQ) or scramble siRNA (si-cont) and were analyzed with the Boyden chamber assay. Data represent the mean ± SD of three independent experiments. P-value was determined by the Student’s t test. (D) SNU C5 cells were transfected with WT RHOQ, N136S edited RHOQ (EDT), KRAS mutant (G12D), or empty vector control (Mock) for 72 h. Cell invasion was analyzed with the Boyden chamber assay. Bars, 100 µm. Data represent the mean ± SD of three independent experiments. P-values were determined by the Student’s t test. (E) Kaplan-Meier curves of relapse-free survival (RFS) according to RHOQ and KRAS status in stage III and high-risk stage II CRC patients treated with adjuvant chemotherapy. P-value was calculated by the overall comparison log-rank test. *, P < 0.01; **, P < 0.001; ***, P = 0.005.Figure 4.Structure analysis of RhoQ protein. (A) The melting temperature of the WT and edited RhoQ (EDT) are similar. The thermal stabilities of the recombinant RhoQ proteins were measured by thermal denaturation using circular dichroism. The results indicate that the stabilities of the two proteins are rather similar. (B) The crystal structure of the edited (N136S) RhoQ is similar to the WT. The x-ray crystal structure of the edited RhoQ was determined and compared with that of the previously reported WT RhoQ. The analysis indicates that there are no changes in the global or the local structural folds. The protein is shown using a ribbon diagram. The nonhydrolysable GTP analogue (GppNHp) and the side chain of residue 136 are shown in stick models. The WT RhoQ structure is available from the Protein Data Bank (PDB) under accession code 2ATX. (C) The regions around N136 may be important in mediating protein–protein interaction. The structure of RhoQ was superimposed on the Ras-related Rap GTPase of the Rap–RapGAP complex. The analysis suggests that the helix containing N136 may be important in forming the protein interaction surface of RhoQ. RhoQ, Rap, and the two RapGAPs of the crystal asymmetric unit are shown in ribbon diagrams with the GTP analogue. RhoQ and Rap–RapGAP structures are from PDB under accession codes 2ATX and 3BRW, respectively. (D) Amino acid sequence comparison among the orthologues at the RHOQ RNA editing site (above). The RhoQ amino acid sequence of C. lupus, D. rerio, G. gallus, P. troglodytes, M. musculus, R. norvegicus, B. taurus, and H. sapiens are compared. The box indicates the RNA editing site of RHOQ (N136). Amino acid sequence comparison among the paralogs at the RHOQ RNA editing site (below). The amino acid sequences of human RhoQ, RhoJ, Cda42, Rac1, Rac2, Rac3, RhoG, RhoU, and RhoV are compared. Sequence alignment was performed using ClustalW program. Residues are colored according to the physicochemical properties: small and hydrophobic residues in red (AVFPMILW); acidic residues in blue (DE); basic residues in magenta (RK); and residues containing a hydroxyl, sulfhydryl, or sidechain amide group in green (STYHCNQ).
그림 출처: PubMed Central 공개 논문 (PMC3978269)
그 밖의 정보
출판 형태
Journal Article, Research Support, Non-U.S. Gov't
저널
The Journal of experimental medicine · eISSN 1540-9538