Laboratory of Mucosal Immunology, Department of Biomedical Sciences, Seoul National University College of Medicine, Seoul, Korea.
Department of Biomedical Sciences, BK21 Plus Biomedical Science Project, Seoul National University College of Medicine, Seoul, Korea.
Institute of Allergy and Clinical Immunology, Seoul National University Medical Research Center, Seoul, Korea.
Interdisciplinary Program in Precision Public Health, Korea University, Seoul, Korea.
Interdisciplinary Program in Bioinformatics, Seoul National University College of Natural Sciences, Seoul, Korea.
Department of Internal Medicine, Seoul National University Hospital, Seoul, Korea.
Department of Internal Medicine, Kyung Hee University Hospital, Seoul, Korea.
Department of Pharmacology, Ajou University School of Medicine, Suwon, Korea.
Department of Biomedical Sciences, Graduate School, Ajou University School of Medicine, Suwon, Korea.
Center for Immune Research on Non-Lymphoid Organ (CIRNO), Sungkyunkwan University, Suwon, Korea.
Department of Biological Sciences, Sungkyunkwan University, Suwon, Korea.
Department of Pathology, Seoul National University College of Medicine, Seoul, Korea.
Laboratory of Immune Regulation, Department of Biomedical Sciences, Seoul National University College of Medicine, Seoul, Korea.
Department of Public Health Sciences, Seoul National University, Seoul, Korea.
RexSoft Corps, Seoul, Korea.
Institute of Health and Environment, Seoul National University, Seoul, Korea.
School of Biosystems and Biomedical Sciences, Korea University, Seoul, Korea.
Abstract
Asthma is a heterogeneous disease whose development is shaped by a variety of environmental and genetic factors. While several recent studies suggest that microbial dysbiosis in the gut may promote asthma, little is known about the relationship between the recently discovered lung microbiome and asthma. Innate lymphoid cells (ILCs) have also been shown recently to participate in asthma. To investigate the relationship between the lung microbiome, ILCs, and asthma, we recruited 23 healthy controls (HC), 42 patients with non-severe asthma, and 32 patients with severe asthma. Flow cytometry analysis showed severe asthma associated with fewer natural cytotoxicity receptor (NCR)+ILC3s in the lung. Similar changes in other ILC subsets, macrophages, and monocytes were not observed. The asthma patients did not differ from the HC in terms of the alpha and beta-diversity of the lung and gut microbiomes. However, lung function correlated positively with both NCR+ILC3 frequencies and microbial diversity in the lung. Sputum NCR+ILC3 frequencies correlated positively with lung microbiome diversity in the HC, but this relationship was inversed in severe asthma. Together, these data suggest that airway NCR+ILC3s may contribute to a healthy commensal diversity and normal lung function.
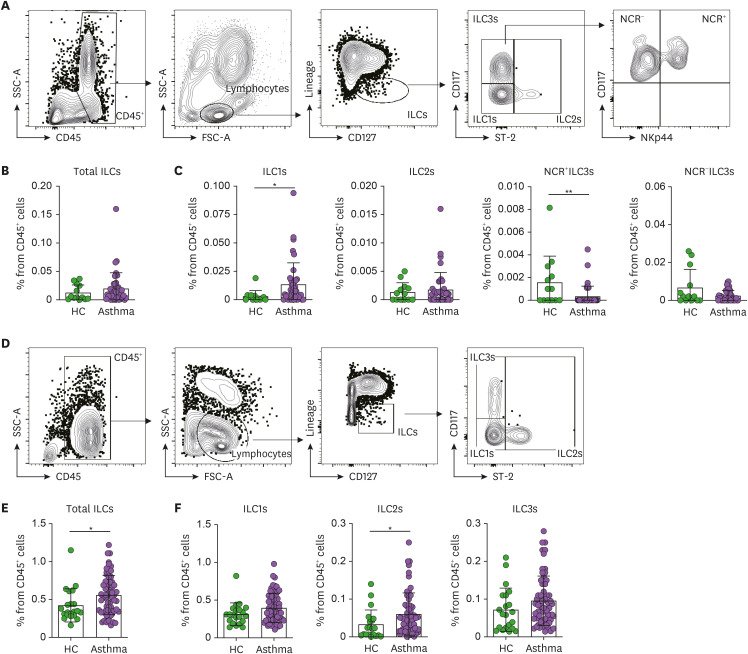
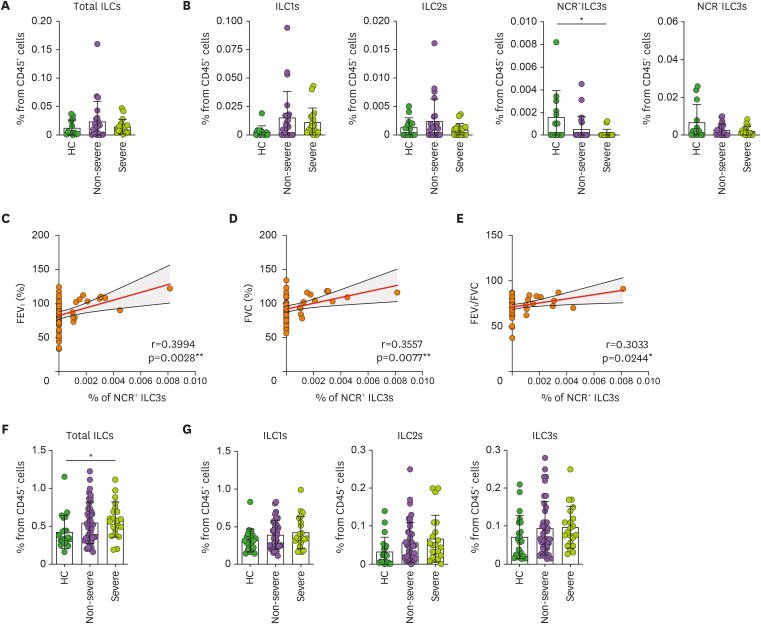
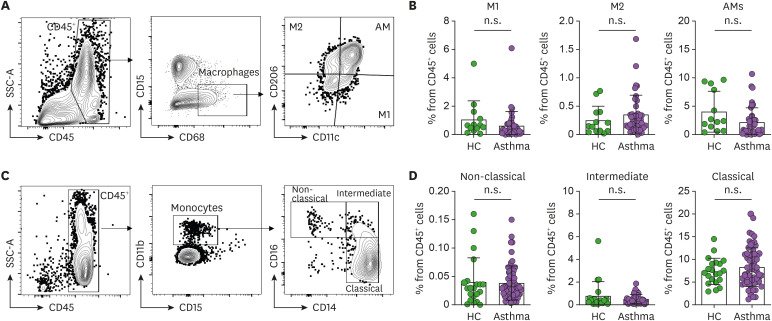
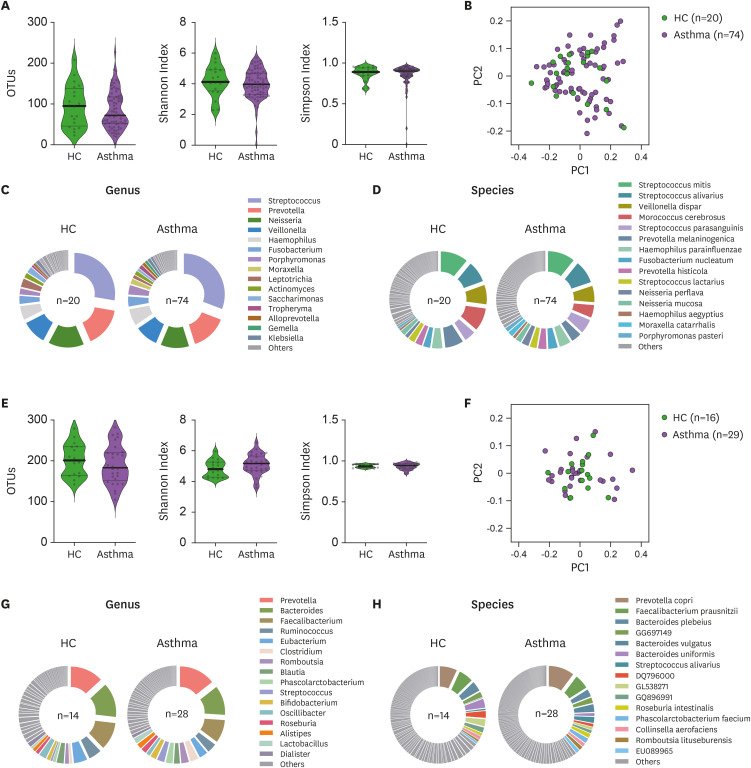
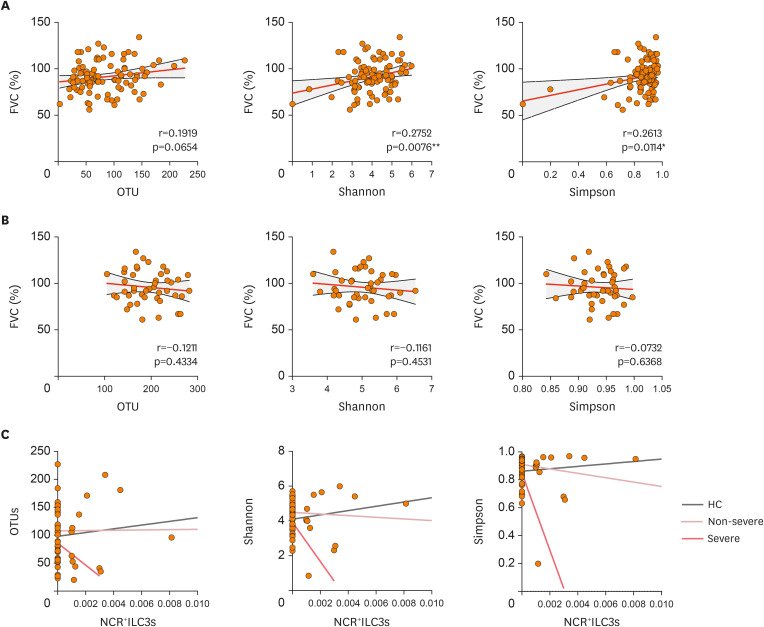
Figure 1 Frequencies of ILC subsets in the induced sputum and peripheral blood. (A) Gating strategy used to identify the ILCs in the sputum. The total ILCs in the CD45+ lymphocytes were gated as Lineage (CD3ε, CD11c, CD11b, CD14, CD19, CD49b, and FcεRIα)-negative and CD127 (IL-7R)-positive cells. The ILC1s, ILC2s, and ILC3s were then determined by assessing ST-2 and CD117 expression. (B, C) Frequencies of total ILCs (B) and each ILC subset (C) in the HC (n=15) and asthma patients (n=41). The 2 ILC3 subtypes were identified based on their NCR (NKp44) expression. (D) Gating strategy used to identify the ILCs in the peripheral blood. The total ILCs in the CD45+ lymphocytes were gated as Lineage−CD127+ cells. The ILC1, ILC2, and ILC3 subsets were then determined by assessing ST-2 and CD117 expression. (E, F) Frequencies of total ILCs (E) and each ILC subset (F) in the HC (n=21) and asthma patients (n=62). The healthy control and asthma groups were compared in terms of ILC frequencies using the Mann-Whitney U test or unpaired t-tests. Each dot represents one human sample. The data are presented as mean±SD. *p<0.05; **p<0.01.Figure 2 Correlation between sputum NCR+ILC3 frequencies and asthma severity. (A, B) Frequencies of the total ILCs (A) and ILC subsets (B) in the sputum of HC (n=15), non-severe asthma patients (n=23), and severe asthma patients (n=18). (C-E) Correlation between NCR+ILC3 frequencies in the sputum and pulmonary function indicators, namely, FEV1 (C), FVC (D), and FEV1/FVC (E). (F, G) Frequencies of the total ILCs (F) and ILC subsets (G) in the blood of HC (n=21), non-severe asthma patients (n=41), and severe asthma patients (n=21). The healthy control, non-severe asthma, and severe asthma groups were compared by ordinary one-way ANOVA (parametric data) or Kruskal-Wallis test (non-parametric data). The correlations between sputum NCR+ILC3 frequencies and pulmonary function indicators were determined by Pearson or Spearman r correlation tests depending on data normality. Each dot represents one human sample. The data are presented as mean±SD. *p<0.05.Figure 3 Frequencies of macrophage and monocyte subsets in the induced sputum and peripheral blood (A) Gating strategy used to identify polarized phenotypes of sputum macrophages. The total macrophages in CD45+ cells were gated as CD15−CD68+ cells, after which M1 macrophages, M2 macrophages, and AMs were identified on the basis of CD11c and CD206 expression. (B) Frequencies of the 3 macrophage populations in the sputum of the HC (n=15) and asthma patients (n=41). (C) Gating strategy used to identify peripheral blood monocyte subsets. The total monocytes in CD45+ cells were gated as CD15−CD11b+ cells, after which classical (CD14hiCD16low), intermediate (CD14hiCD16hi), and non-classical monocyte (CD14lowCD16hi) subsets were identified on the basis of their CD14 and CD16 expression. (D) Frequencies of the 3 monocyte subsets in the blood of HC (n=21) and asthma patients (n=62). The healthy control and asthmatic groups were compared by either the Mann-Whitney U test or unpaired t-tests. Each dot represents one human sample. The data are presented as mean±SD. n.s., not significant.Figure 4 Microbiome diversity and abundance in the airway and gut of HC and asthma patients. (A) Sputum microbiome alpha-diversity in the HC (n=20) and asthma patients (n=74) was measured by counting the OTUs or using the Shannon and Simpson indices. (B) Sputum microbiome beta-diversity in the HC (n=20) and asthma patients (n=74) was measured by using the weighted normalized UniFrac distance matrix. (C, D) Phi-charts showing the relative microbial abundances in the sputum from HC (n=20) and asthma patients (n=74). The top 15 genera (C) and species (D) in the sputum microbiomes were shown. (E) Gut microbiome alpha-diversity in the HC (n=14) and asthma patients (n=28) was measured by counting the OTUs or using the Shannon and Simpson indices. (F) Gut microbiome beta-diversity in the HC (n=14) and asthma patients (n=28) was measured by using the weighted normalized UniFrac distance matrix. (G, H) Phi-charts showing the relative microbial abundances in the gut of HC (n=14) and asthma patients (n=28). The top 15 genera (G) and species (H) in the gut microbiomes were shown. The healthy control and asthma groups were compared in terms of alpha-diversity data (the OTU, Shannan index, and Simpson index data) by Mann-Whitney U test or unpaired t-tests. Each dot represents one human sample. Figure 5 Correlations between microbiome diversity, sputum NCR+ILC3 frequencies, and asthma severity. (A, B) Correlations between FVC and microbial alpha-diversity in the sputum (A) or gut (B). (C) Correlations between sputum NCR+ILC3 frequencies and sputum microbial alpha-diversity in HC (gray linear regression line), non-severe asthma patients (pink), and severe asthma patients (red). The correlations between FVC and microbial alpha-diversity were determined with Pearson or Spearman r correlation tests depending on data normality. The correlations between sputum NCR+ILC3 frequencies and sputum microbiome alpha-diversity were determined with Pearson's r correlation test. Each dot represents one human sample.
그림 출처: PubMed Central 공개 논문 (PMC8410993)
Conflict of interest statement
Conflict of Interest: The authors declare no potential conflicts of interest.