Department of Biomedical Sciences, Seoul National University College of Medicine, 28 Yongon-Dong, Seoul 110-799, Republic of Korea.
Abstract
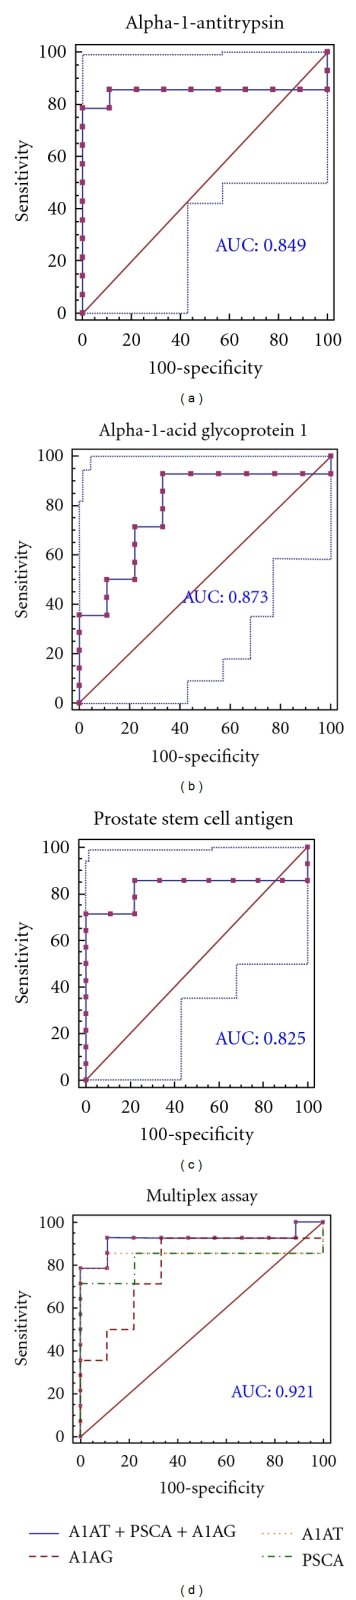
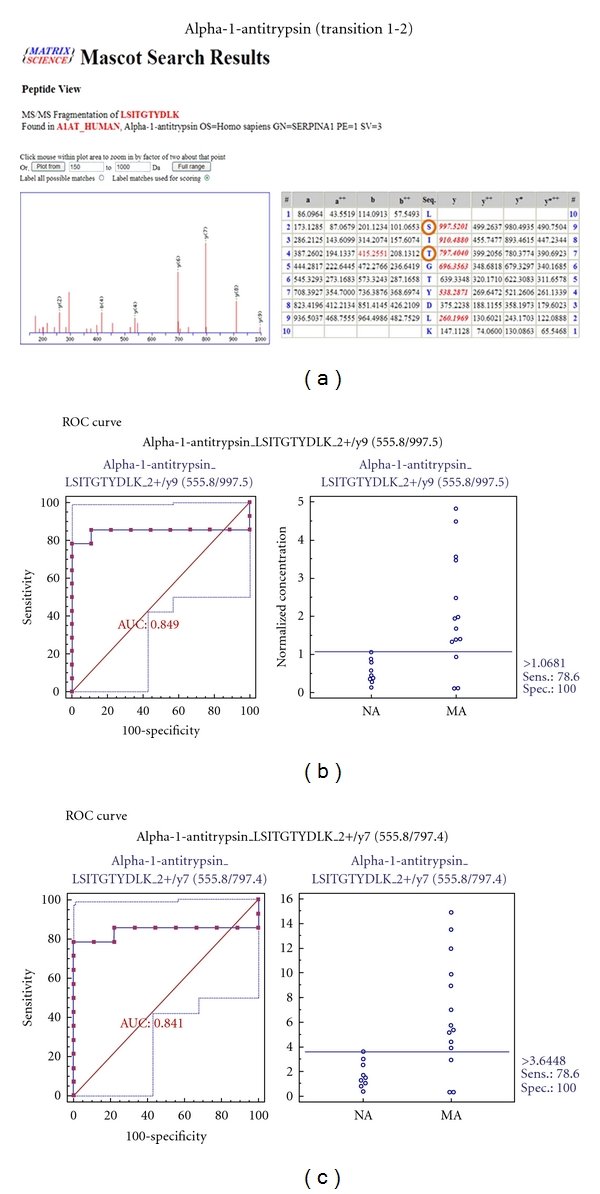
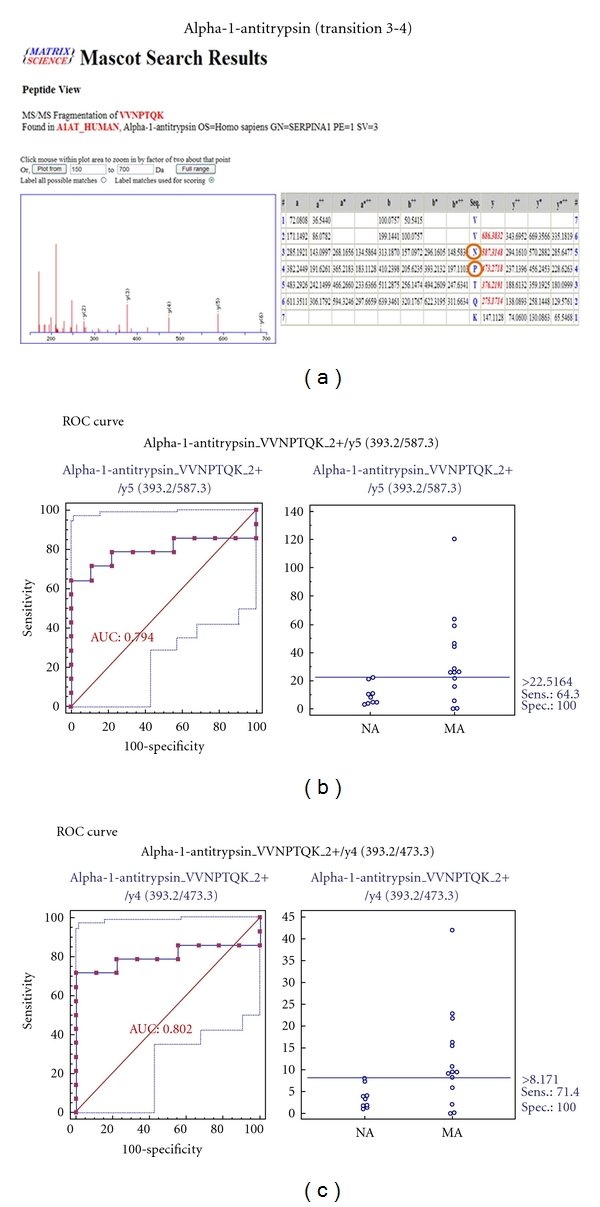
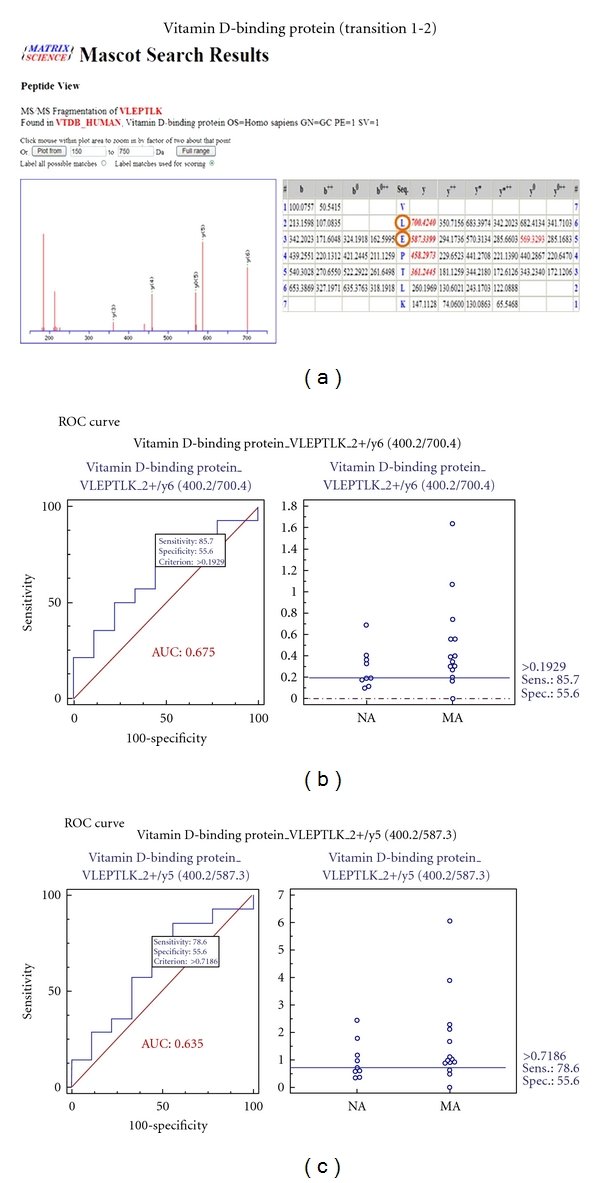
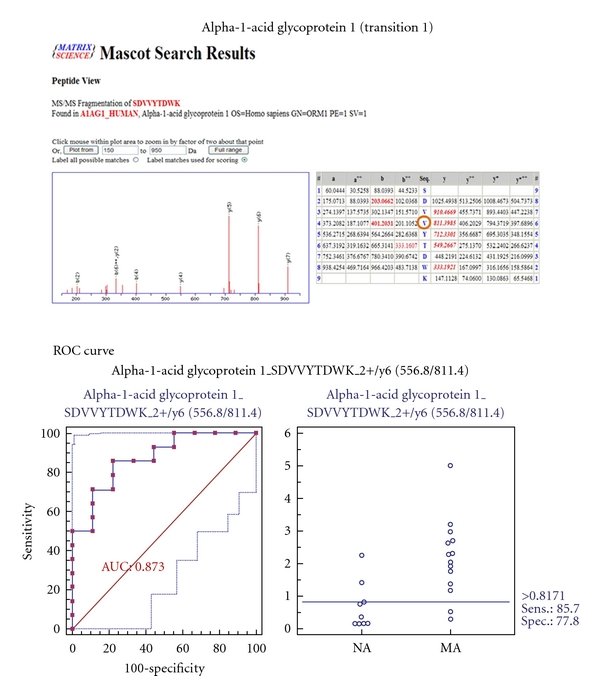
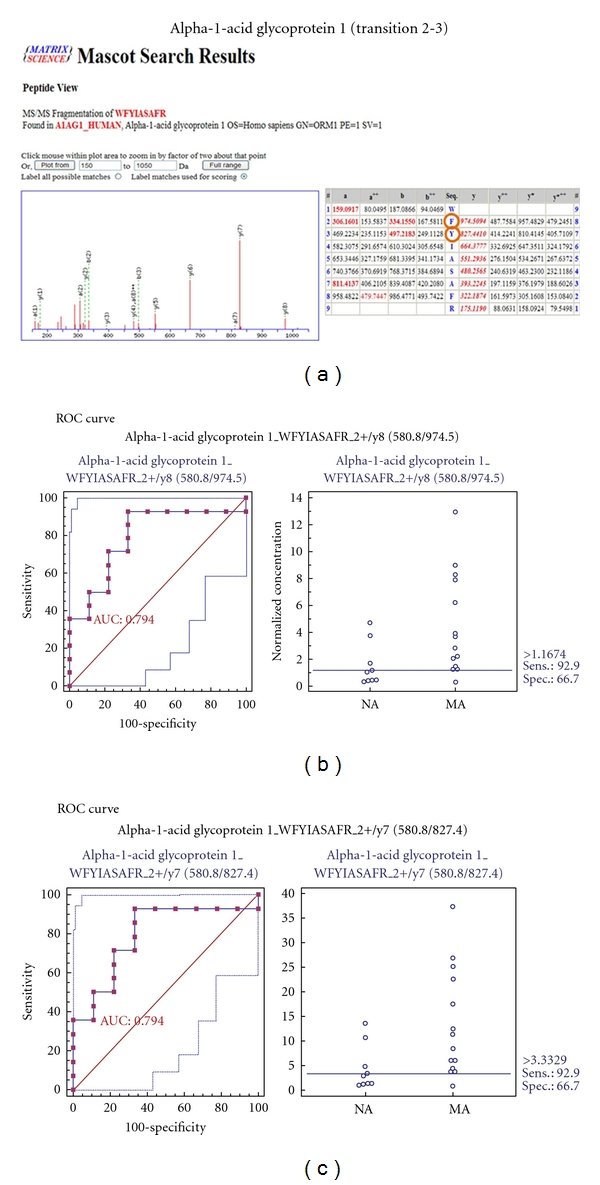
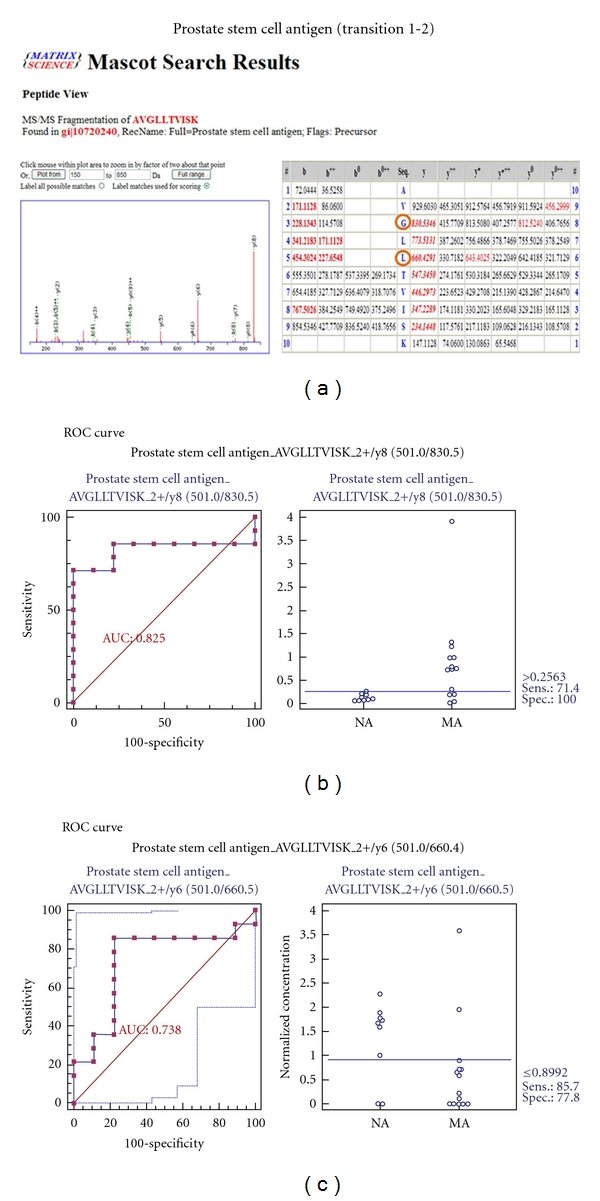
Diabetic nephropathy (DN) is a long-term complication of diabetes mellitus that leads to end-stage renal disease. Microalbuminuria is used for the early detection of diabetic renal damage, but such levels do not reflect the state of incipient DN precisely in type 2 diabetic patients because microalbuminuria develops in other diseases, necessitating more accurate biomarkers that detect incipient DN. Isobaric tags for relative and absolute quantification (iTRAQ) were used to identify urinary proteins that were differentially excreted in normoalbuminuric and microalbuminuric patients with type 2 diabetes where 710 and 196 proteins were identified and quantified, respectively. Some candidates were confirmed by 2-DE analysis, or validated by Western blot and multiple reaction monitoring (MRM). Specifically, some differentially expressed proteins were verified by MRM in urine from normoalbuminuric and microalbuminuric patients with type 2 diabetes, wherein alpha-1-antitrypsin, alpha-1-acid glycoprotein 1, and prostate stem cell antigen had excellent AUC values (0.849, 0.873, and 0.825, resp.). Moreover, we performed a multiplex assay using these biomarker candidates, resulting in a merged AUC value of 0.921. Although the differentially expressed proteins in this iTRAQ study require further validation in larger and categorized sample groups, they constitute baseline data on preliminary biomarker candidates that can be used to discover novel biomarkers for incipient DN.
Figures
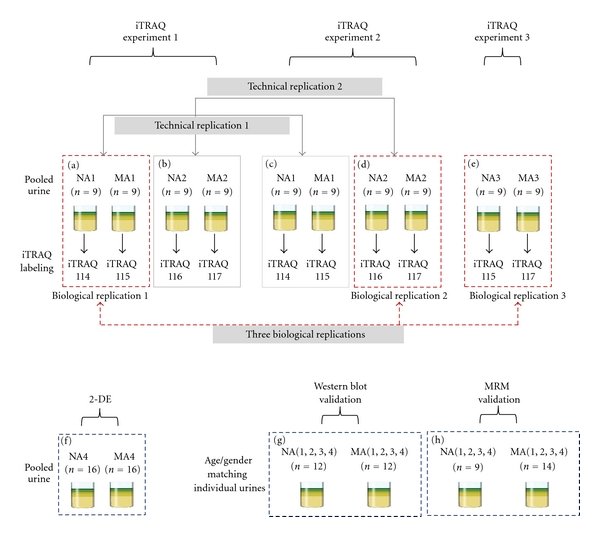
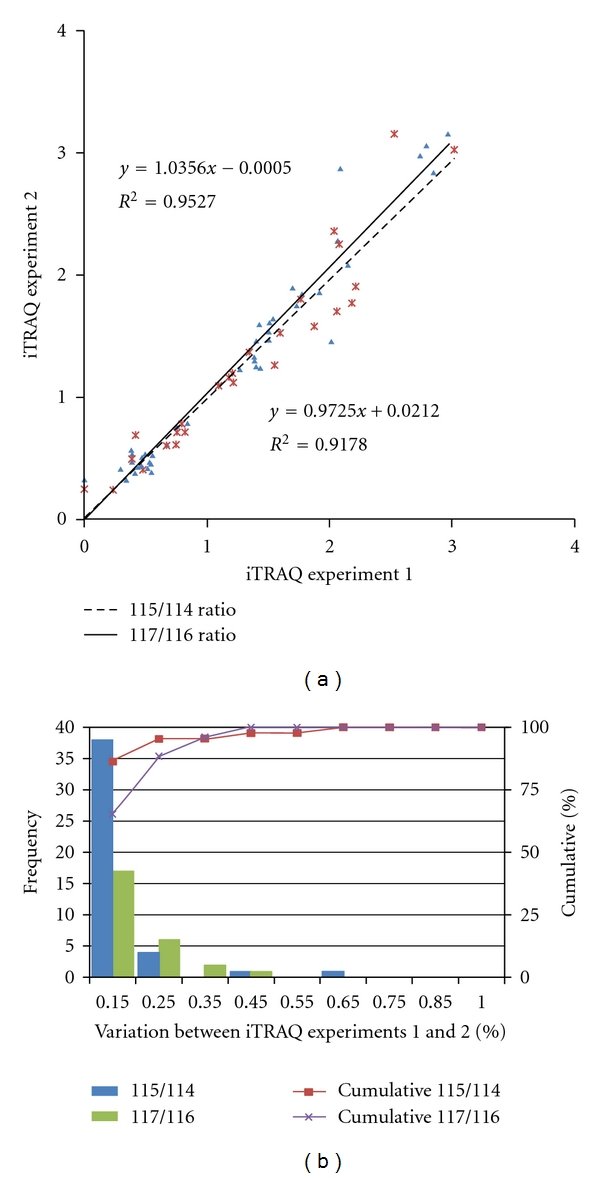
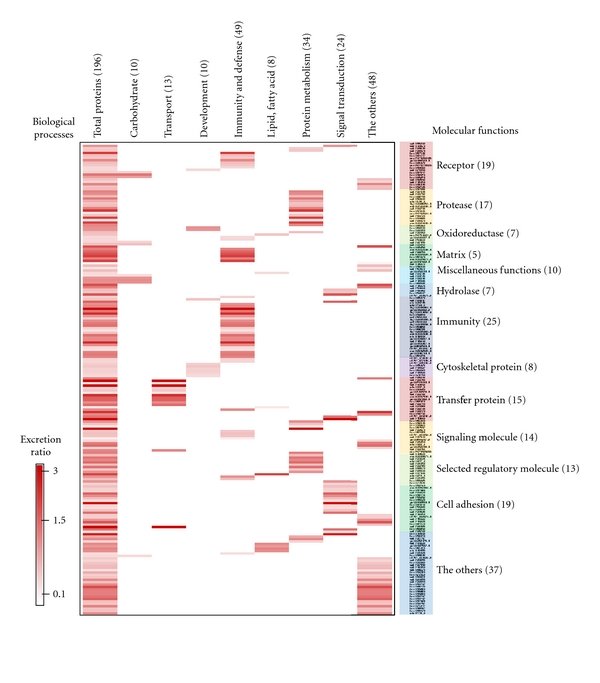
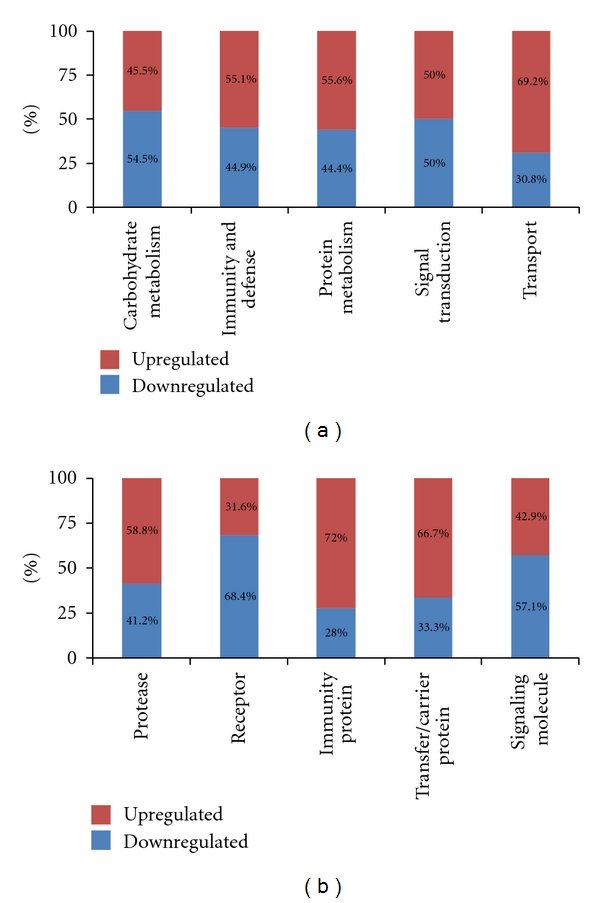
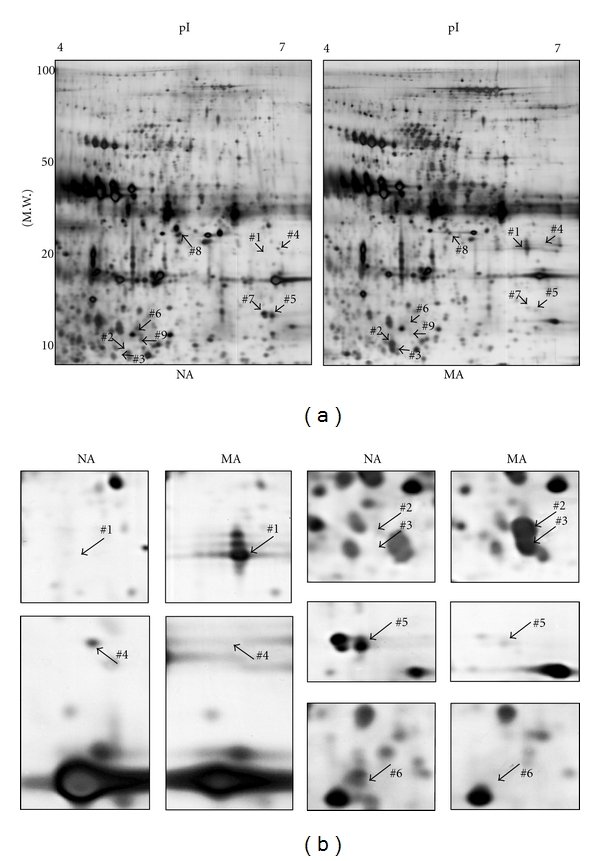
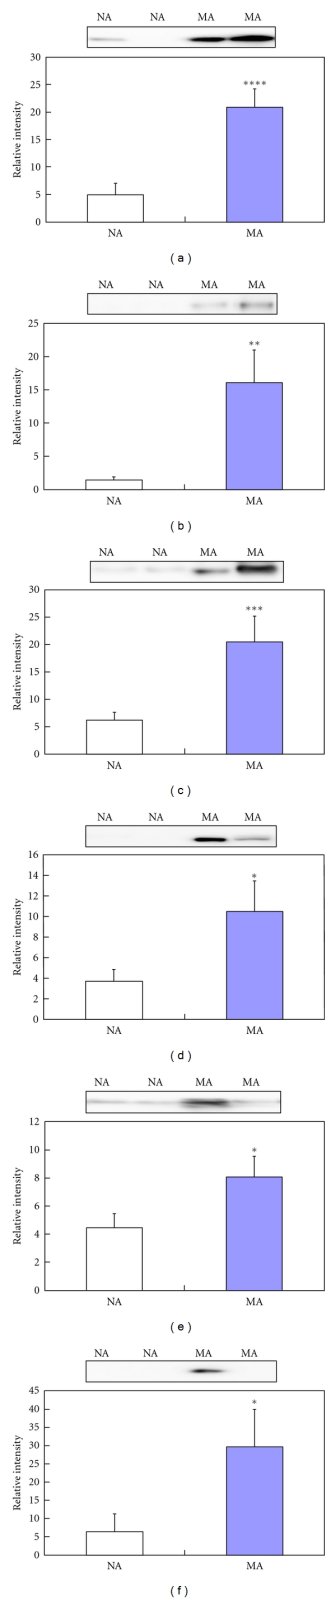
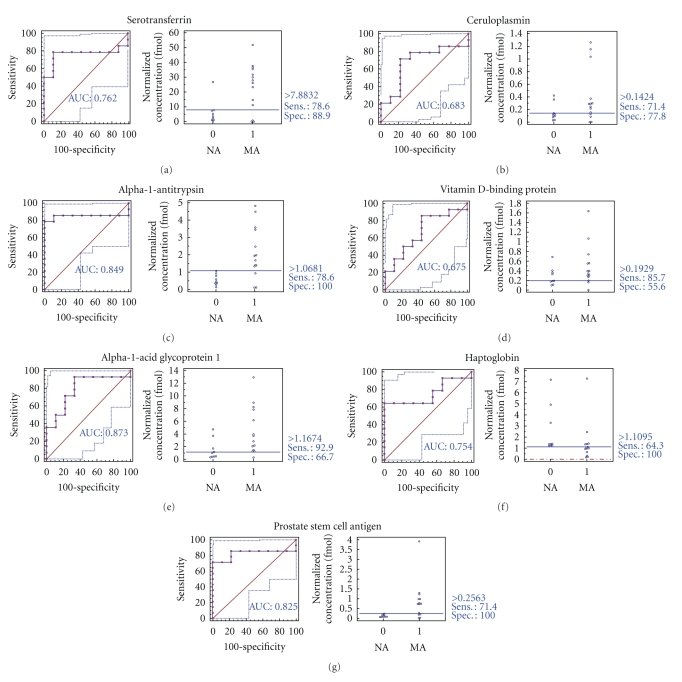
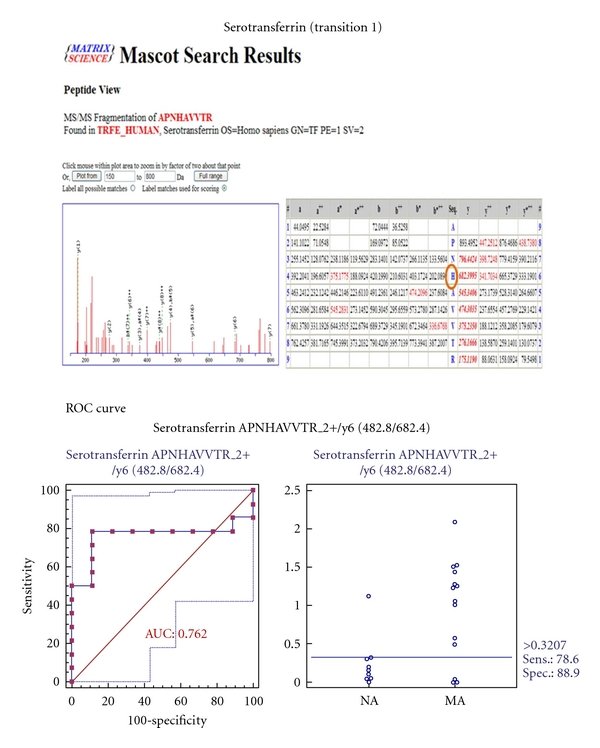
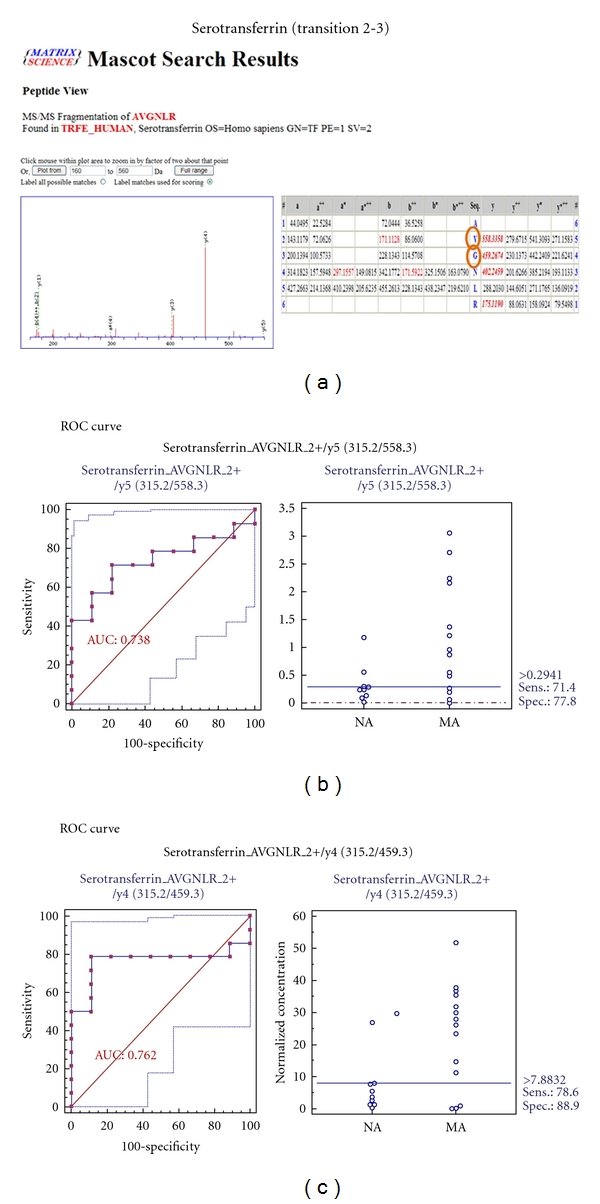
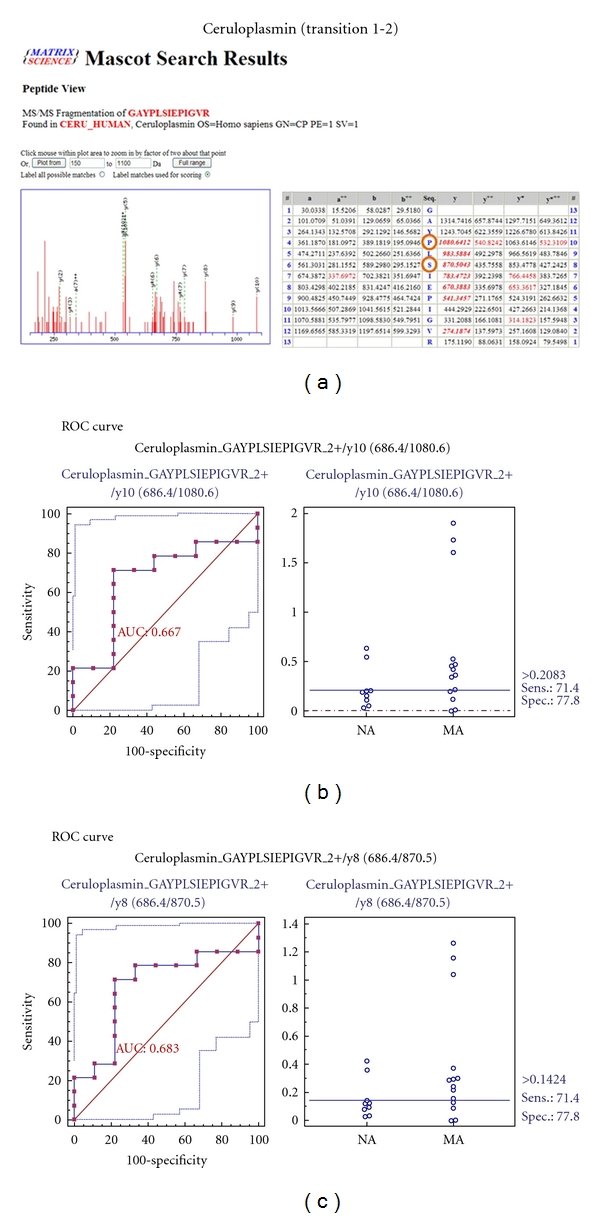
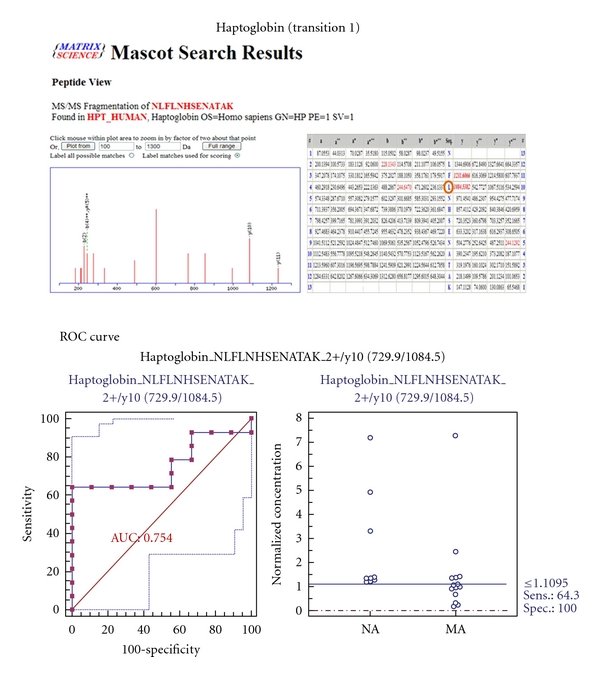
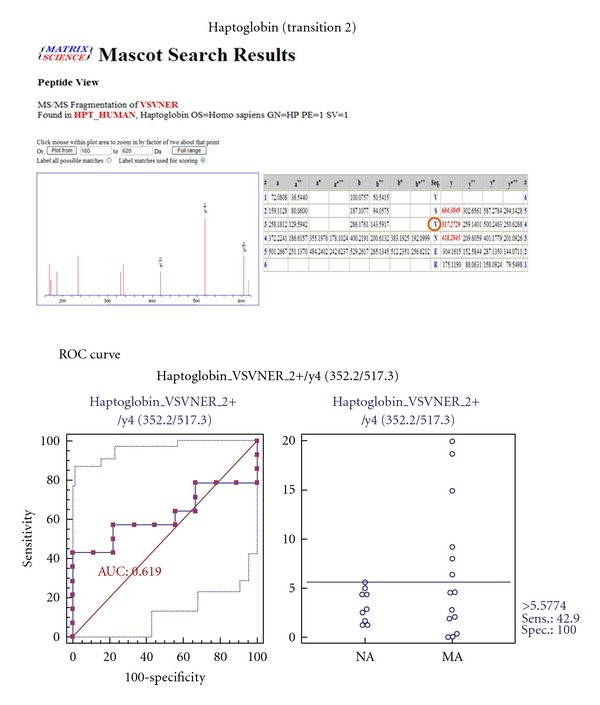
Figure 1Workflow of iTRAQ, 2-DE, Western blot, and MRM of the urinary proteome. For analysis of the urinary proteome, 3 iTRAQ experiments were performed, 2-DE, Western blot, and MRM were conducted to confirm and validate the iTRAQ results. iTRAQ experiments 1, 2, and 3 were performed, labeled (a) and (b), (c) and (d), and (e), respectively, wherein 3 biological replicates (labeled (a), (d), and (e), resp.), technical replicate 1 (labeled (a) and (c)), and technical replicate 2 (labeled (b) and (d)) were performed in microalbuminuric versus normoalbuminuric urine. 2-DE, Western blot, and MRM analysis of the urinary proteome were conducted using labeled (f), (g), and (h), respectively.Figure 2Correlation between the 2 technical replicates and determination of the cutoff value for significant fold changes. (a) Plots of iTRAQ ratios for two technical replicates. Forty-four proteins were commonly observed from technical replicate 1 (labeled 115/114), and 26 proteins were commonly observed from technical replicate 2 (labeled 117/116). These differentially excreted proteins (P value < 0.05, more than two unique peptides: >95%) were plotted in the linear dynamic range. The technical variations yielded a correlation coefficient of r2 = 0.9527 and r2 = 0.9178 between iTRAQ experiments 1 and 2, respectively. (b) The % variations for the common proteins from the two technical replicates. The 44 and 26 common proteins from the 2 technical replicates were used as inputs to calculate % variations. The vertical axis represents the number of proteins, and the horizontal axis denotes % variation. Ninety percent of the proteins fell within 25% of the respective experimental variation. Thus, we considered a fold-change of >1.25 or <0.80, a meaningful cutoff that represented actual differences in the iTRAQ experiments.Figure 3Comprehensive functional annotation of the differentially excreted proteome. The 196 quantitated urinary proteins were annotated for the “biological process” (x-axis) and “molecular function” subcategories (y-axis) in a heatmap. The “biological process” and “molecular function” categories comprised 8 and 13 subcategories, respectively. The 196 quantitated urinary proteins are individually assigned into the “biological process” and “molecular function” subcategories.Figure 4Functional distribution of differentially excreted proteins in microalbuminuria versus normoalbuminuria. Functional classification of differentially excreted proteins into (a) “biological process” and (b) “molecular function.” Only 5 major subcategories for “biological process” and “molecular function” are shown; each subcategory is presented as the percentage of up- and down-regulated proteins.Figure 5Differentially excreted proteins by 2-DE in microalbuminuria versus normoalbuminuria. (a) Representative whole 2-DE images of normoalbuminuric (NA) and microalbuminuric (MA) urine. Total protein (100 μg) samples were loaded onto IPG strips (pH 4–7, nonlinear) for IEF and separated in the second dimension on a 12% polyacrylamide gel. The horizontal and vertical axes represent pI and molecular weight, respectively. The arrowed numbers denote for differentially excreted proteins and correspond to the proteins in Table 3. (b) Magnified sections of differentially excreted proteins in the 2-DE gel. Some arrowed proteins in the 2-DE gel (Figure 5(a)) were magnified side by side to compare their relative expression.Figure 6Validation using Western blot for six representative differentially excreted proteins. The concentrations of transferrin (a), ceruloplasmin (b), α1-antitrypsin (c), vitamin D-binding protein (d), α1-acid glycoprotein (e), and haptoglobin (f) are significantly higher in microalbuminuric patients versus normoalbuminuric urine. The relative intensities on the vertical axis indicate normalized values versus the representative control. Each bar represents the mean ± SEM, based on the relative intensities of the gel bands. Statistical significance for the differences (*P < 0.05; **P < 0.01; ***P < 0.005; ****P < 0.0005) were determined by paired Student's t-test. Two representative NA and MA blots are shown at the top of the bar graphs.Figure 7ROC curves and interactive plots for MRM validation in normoalbuminuric versus microalbuminuric urine. Seven biomarker candidates (TF, CP, A1AT, VDBP, AGP1, HP, and PSCA) were validated by MRM, in which 9 normoalbuminuric and 14 microalbuminuric urine samples were used. (a)–(g) Interactive plots and ROC curves for TF, CP, A1AT, VDBP, AGP1, HP, and PSCA. In the ROC curves, the solid lines represent the corresponding score in sensitivity (x-axis) and 100-specificity (y-axis). In the interactive plots, the y-axis indicates the normalized concentration of the target protein against the spiked internal standard (50 fmol of beta-galactosidase peptide). Sens. and Spec. represent the sensitivity and specificity for the target proteins, respectively. The AUC values are shown inside the ROC curves.Figure 8ROC curves for three candidate biomarkers and the 3-marker panel. MRM validation was performed for (a) alpha-1-antitrypsin, (b) alpha-1-acid glycoprotein 1, (c) prostate stem cell antigen, and (d) their combination, generating AUC values of 0.849, 0.873, and 0.825, respectively, whereas the combination resulted in a merged AUC of 0.921.Figure 9Figure 10Figure 11Figure 12Figure 13Figure 14Figure 15Figure 16Figure 17Figure 18Figure 19