
Cardiovasc Diabetol. 2018;17(1):10.
Increased epicardial adipose tissue thickness is a predictor of new-onset diabetes mellitus in patients with coronary artery disease treated with high-intensity statins.
제1저자 강지훈 · 교신저자 조영석
소속 (6)
- Department of Internal Medicine, Seoul National University Bundang Hospital, 82 Gumiro173 Beongil, Bundang, Seongnam, Gyeonggi, 13620, South Korea.
- Department of Internal Medicine, Seoul National University Hospital, Seoul, South Korea.
- Division of Cardiology, Hallym University Hangang Sacred Heart Hospital, Seoul, South Korea.
- Department of Internal Medicine, Seoul National University Bundang Hospital, 82 Gumiro173 Beongil, Bundang, Seongnam, Gyeonggi, 13620, South Korea. flammeus1@gmail.com.
- Seoul National University College of Medicine, Seoul, South Korea. flammeus1@gmail.com.
- Seoul National University College of Medicine, Seoul, South Korea.
Abstract
BACKGROUND Statins are widely used for lipid lowering in patients with coronary artery disease (CAD), but increasing evidence indicates an association between statin use and new-onset of diabetes mellitus (NODM). Epicardial adipose tissue (EAT) refers to the visceral fat surrounding the heart, which is associated with metabolic diseases. We sought to determine the association between EAT thickness and NODM in CAD patients treated with high-intensity statins.
METHODS We conducted a retrospective medical record review of CAD patients treated with high-intensity statins for at least 6 months after percutaneous coronary intervention performed between January 2009 and June 2013 at Seoul National University Bundang Hospital. EAT thickness was measured by echocardiography using standardized methods.
RESULTS A total of 321 patients were enrolled, who received high-intensity statins for a mean of 952 days; atorvastatin 40 mg in 204 patients (63.6%), atorvastatin 80 mg in 57 patients (17.8%), and rosuvastatin 20 mg in 60 patients (18.7%). During the follow-up period of 3.9 ± 1.7 years, NODM occurred in 40 patients (12.5%). On Cox proportional-hazard regression analysis, EAT thickness at systole [for each 1 mm: hazard ratio (HR) 1.580; 95% confidence interval (CI) 1.346-1.854; P < 0.001] and prediabetes at baseline (HR 4.321; 95% CI 1.998-9.349; P < 0.001) were the only independent predictors of NODM. Using binary cutoff values derived from the receiver operating characteristic curve analysis, EAT thickness at systole larger than 5.0 mm had an HR of 3.402 (95% CI 1.751-6.611, P < 0.001), sensitivity of 52.5%, and specificity of 80.8% for predicting NODM. Also, patients with EAT thickness ≥ 5 mm and prediabetes at baseline had a 12.0-times higher risk of developing NODM compared to the risk noted in patients with EAT thickness < 5 mm and normal glucose tolerance at baseline.
CONCLUSION Epicardial adipose tissue thickness at systole is a consistent independent predictor of NODM in patients with CAD treated with high-intensity statins. Such predictors may help physicians plan adequate surveillance for early detection of NODM.
Keywords
Coronary artery diseaseEchocardiographyEpicardial adipose tissueNew-onset diabetes mellitusStatin
Figures
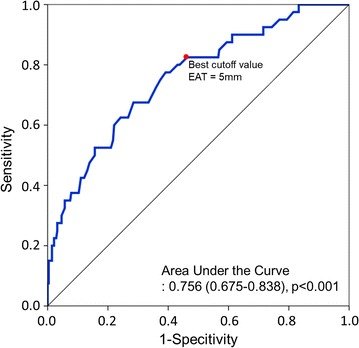
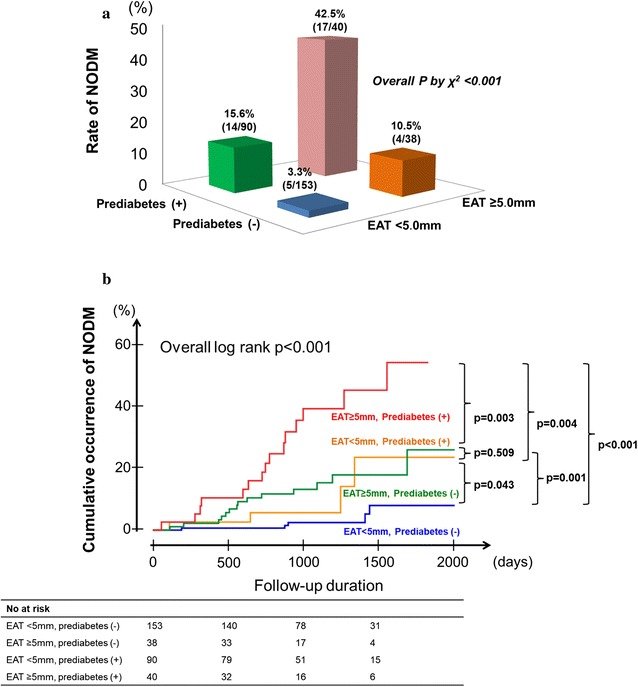
그림 출처: PubMed Central 공개 논문 (PMC5763639)
그 밖의 정보
- 출판 형태
- Journal Article
- 저널
- Cardiovascular diabetology · eISSN 1475-2840
- 전자 출판
- 2018-01-11
- MeSH
- Adipose Tissue / diagnostic imaging · Aged · Atorvastatin / administration & dosage / adverse effects · Coronary Artery Disease / complications / diagnostic imaging / drug therapy · Diabetes Mellitus / blood / chemically induced / diagnosis · Echocardiography* · Female · Humans · Hydroxymethylglutaryl-CoA Reductase Inhibitors / administration & dosage / adverse effects · Male · Middle Aged · Pericardium / diagnostic imaging · Predictive Value of Tests · Retrospective Studies · Risk Factors · Rosuvastatin Calcium / administration & dosage / adverse effects · Seoul · Time Factors · Treatment Outcome
- Substances
- Hydroxymethylglutaryl-CoA Reductase Inhibitors · Rosuvastatin Calcium · Atorvastatin
- 참고문헌
- 36편