
PLoS One. 2021;16(3):e0248856.
Association between sarcopenia level and metabolic syndrome.
제1저자 김수환 · 교신저자 정지봉
소속 (5)
- Department of Internal Medicine, Seoul National University College of Medicine, Seoul Metropolitan Government Seoul National University Boramae Medical Center, Seoul, Republic of Korea.
- Health Care Center, Seoul Metropolitan Government Seoul National University Boramae Medical Center, Seoul, Republic of Korea.
- Medical Research Collaborating Center, Seoul Metropolitan Government Seoul National University Boramae Medical Center, Seoul, Republic of Korea.
- Department of Radiology, Seoul National University College of Medicine, Seoul National University Hospital, Seoul, Republic of Korea.
- Department of Research and Development, MEDICALIP Co, Ltd., Seoul, Korea.
Abstract
AIMS Metabolic syndrome (MetS) increases the risk of diabetes mellitus (DM), cardiovascular disease (CVD), cancer, and mortality. Sarcopenia has been reported as a risk factor for MetS, non-alcoholic fatty liver disease, and CVD. To date, the association between sarcopenia and MetS has been investigated. However, there have been few studies on the dose-response relationship between sarcopenia and MetS. We investigated the association between sarcopenia and the prevalence of MetS. We also aimed to analyze the dose-response relationship between skeletal muscle mass and the prevalence of MetS.
METHODS We enrolled 13,620 participants from October 2014 to December 2019. Skeletal muscle mass was measured using bioelectrical impedance analysis (BIA). Appendicular skeletal muscle mass (ASM) was divided by body weight (kg) and was expressed as a percentage (ASM x 100/Weight, ASM%). The quartiles of ASM% were calculated for each gender, with Q1 and Q4 being the lowest and highest quartiles of ASM%, respectively. The quartiles of ASM% were calculated for each gender, with Q1 and Q4 being the lowest and highest quartiles of ASM%, respectively. Linear regression and logistic regression analyses were used to compare the clinical parameters according to ASM%, adjusted for age, sex, obesity, hypertension (HT), DM, dyslipidemia (DL), smoking, alcohol intake, and C-reactive protein (CRP). Multiple logistic regression analysis was performed to determine the risk of MetS in each group.
RESULTS A dose-response relationship was identified between ASM% and MetS. Sarcopenia was associated with an increased prevalence of MetS. After adjustment for age, sex, obesity, HT, DM, DL, smoking, alcohol intake, and CRP, sarcopenia remained significantly associated with MetS. For each 1 quartile increment in ASM%, the risk of MetS decreased by 56% (P< 0.001). After adjusting for age, sex, obesity, HT, DM, DL, smoking, alcohol intake, and CRP, the risk of MetS decreased by 25% per 1Q increment in ASM% (P < 0.001).
CONCLUSIONS Sarcopenia by BIA is independently associated with the risk of MetS and has a dose-response relationship.
Figures
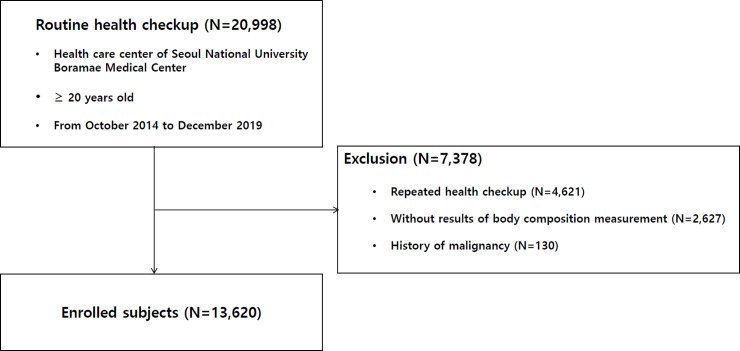
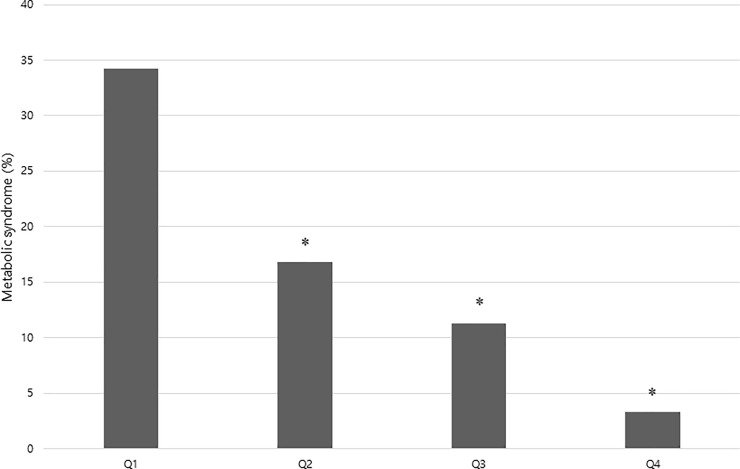
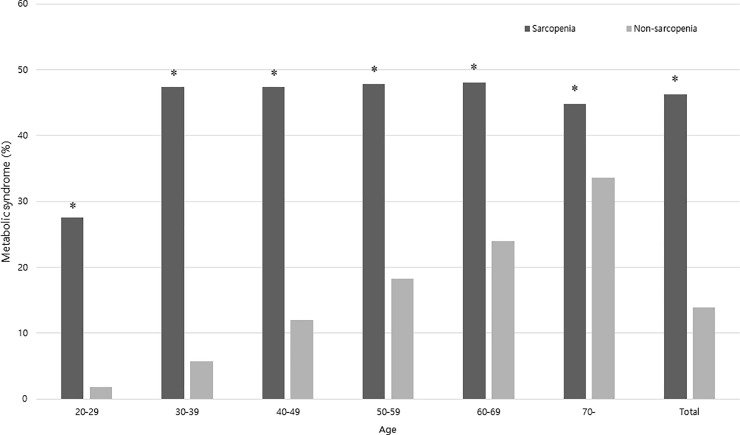
그림 출처: PubMed Central 공개 논문 (PMC7978348)
Conflict of interest statement
DHL is employed by MEDICALIP Co, Ltd. and was provided with support in the form of salaries. This does not alter our adherence to all PLOS ONE policies on sharing data and materials.
그 밖의 정보
- 출판 형태
- Journal Article, Research Support, Non-U.S. Gov't
- 저널
- PloS one · eISSN 1932-6203
- 전자 출판
- 2021-03-19
- MeSH
- Abdominal Fat / diagnostic imaging / pathology · Adult · Female · Humans · Male · Metabolic Syndrome / complications / epidemiology · Middle Aged · Muscles / diagnostic imaging / pathology · Organ Size · Prevalence · Sarcopenia / complications / epidemiology · Tomography, X-Ray Computed
- 참고문헌
- 50편