Bioinformatics Institute, Seoul National University, Seoul, Republic of Korea.
BK21 FOUR Intelligence Computing, Seoul National University, Seoul, Republic of Korea.
Interdisciplinary Program in Bioinformatics, Seoul National University, Seoul, Republic of Korea.
AIGENDRUG Co. Ltd, Seoul, Republic of Korea.
Cancer Research Institute, Seoul National University, Seoul, Republic of Korea.
Department of Internal Medicine, Seoul National University Hospital, Seoul, Republic of Korea.
Center for Medical Innovation, Seoul National University Hospital, Seoul, Republic of Korea.
Genome Opinion Inc, Seoul, Republic of Korea.
Department of Biological Sciences, KI for BioCentury, Korea Advanced Institute of Science and Technology (KAIST), Daejeon, Republic of Korea.
Department of Pathology, Stanford University, Stanford, CA, USA.
Cancer Research Institute, Seoul National University, Seoul, Republic of Korea. ssysmc@snu.ac.kr.
Department of Internal Medicine, Seoul National University Hospital, Seoul, Republic of Korea. ssysmc@snu.ac.kr.
Center for Medical Innovation, Seoul National University Hospital, Seoul, Republic of Korea. ssysmc@snu.ac.kr.
Interdisciplinary Program in Bioinformatics, Seoul National University, Seoul, Republic of Korea. sunkim.bioinfo@snu.ac.kr.
Interdisciplinary Program in Artificial Intelligence, Seoul National University, Seoul, Republic of Korea. sunkim.bioinfo@snu.ac.kr.
Department of Computer Science and Engineering, Seoul National University, Seoul, Republic of Korea. sunkim.bioinfo@snu.ac.kr.
MOGAM Institute for Biomedical Research, Yong-in, Republic of Korea. sunkim.bioinfo@snu.ac.kr.
Cancer Research Institute, Seoul National University, Seoul, Republic of Korea. go01@snu.ac.kr.
Department of Internal Medicine, Seoul National University Hospital, Seoul, Republic of Korea. go01@snu.ac.kr.
Center for Medical Innovation, Seoul National University Hospital, Seoul, Republic of Korea. go01@snu.ac.kr.
Genome Opinion Inc, Seoul, Republic of Korea. go01@snu.ac.kr.
Abstract
The mechanistic link between the complex mutational landscape of de novo methyltransferase DNMT3A and the pathology of acute myeloid leukemia (AML) has not been clearly elucidated so far. Motivated by a recent discovery of the significance of DNMT3A-destabilizing mutations (DNMT3AINS) in AML, we here investigate the common characteristics of DNMT3AINS AML methylomes through computational analyses. We present that methylomes of DNMT3AINS AMLs are considerably different from those of DNMT3AR882 AMLs in that they exhibit increased intratumor DNA methylation heterogeneity in bivalent chromatin domains. This epigenetic heterogeneity was associated with the transcriptional variability of developmental and membrane-associated factors shaping stem cell niche, and also was a predictor of the response of AML cells to hypomethylating agents, implying that the survival of AML cells depends on stochastic DNA methylations at bivalent domains. Altogether, our work provides a novel mechanistic model suggesting the genomic origin of the aberrant epigenomic heterogeneity in disease conditions.
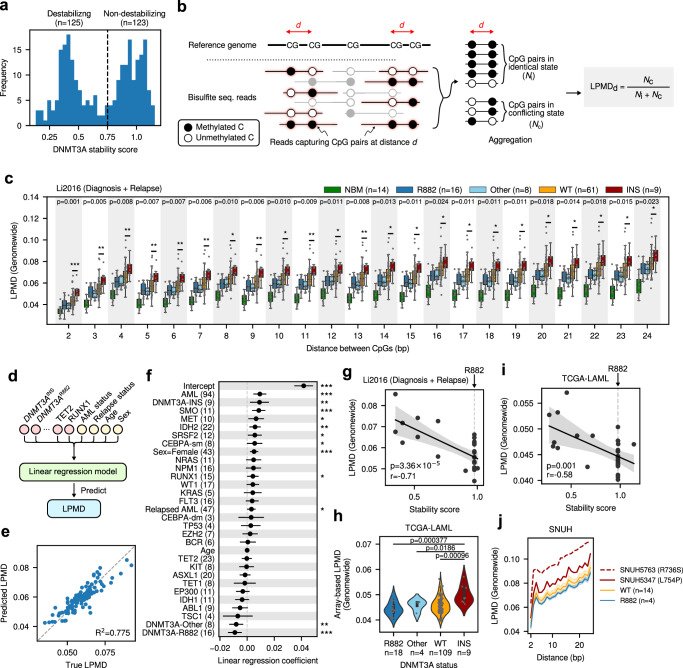
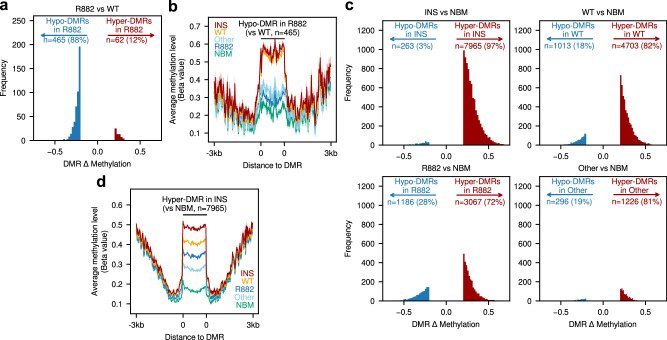
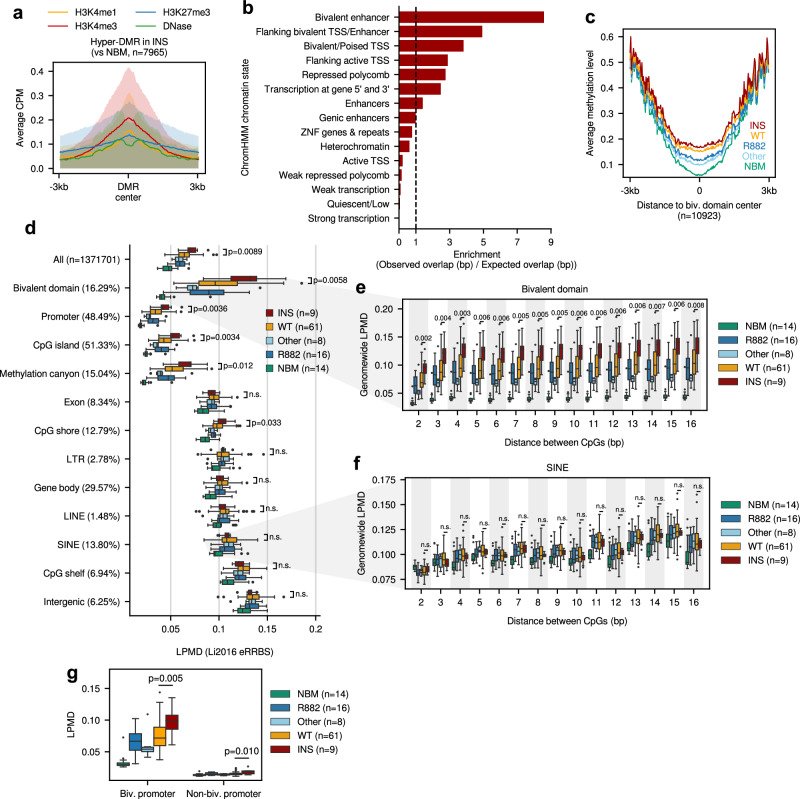
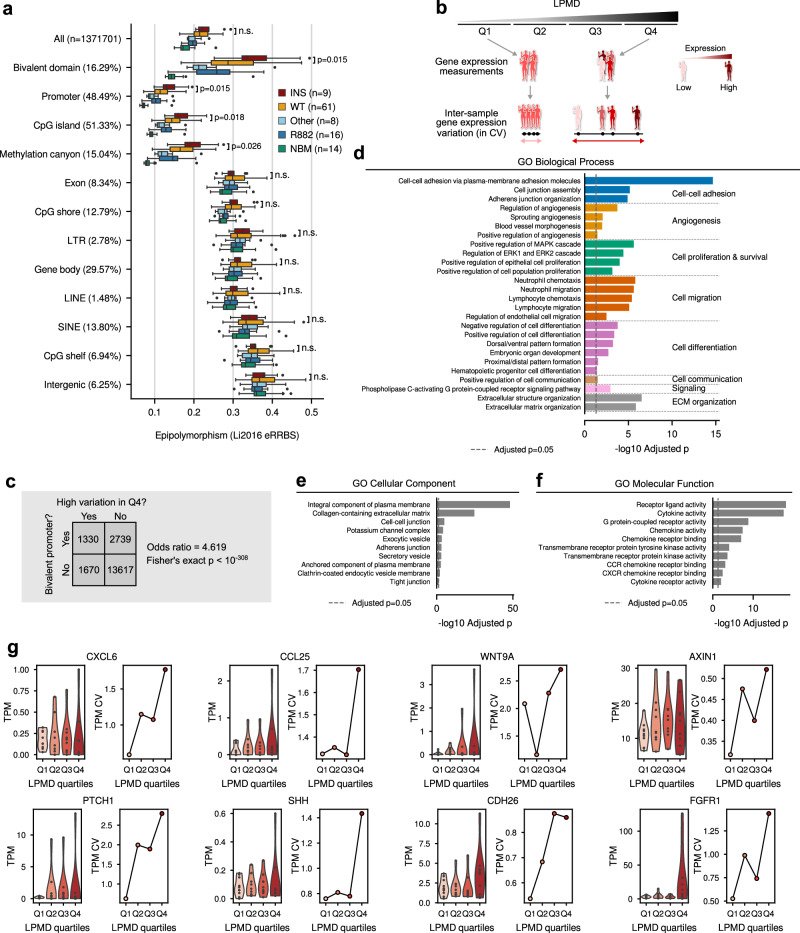
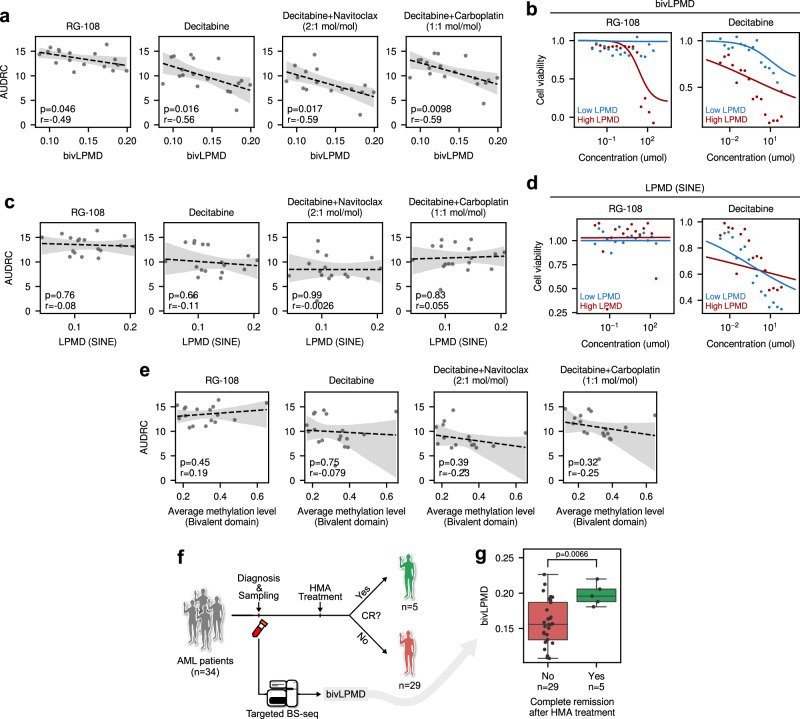
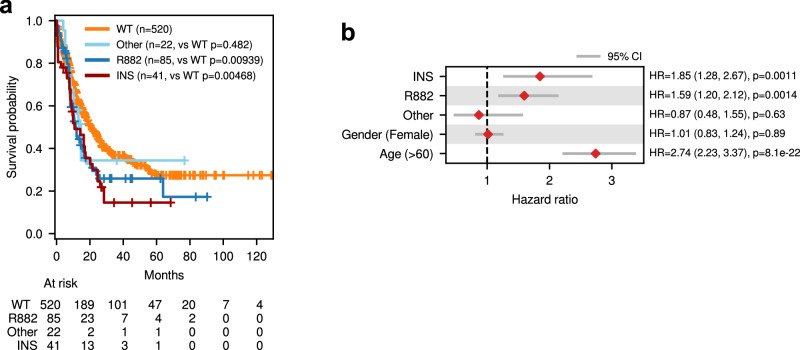
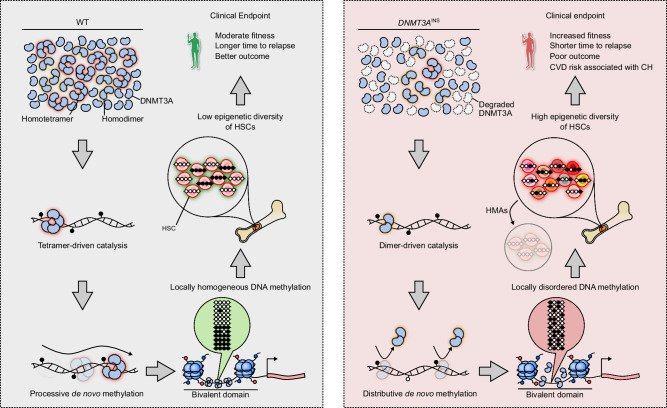
Fig. 1DNMT3AINS AMLs show locally disordered DNA methylation patterns. a Distribution of DNMT3A stability scores for 248 residues across DNMT3A protein. The dotted line denotes the threshold value 0.75 dividing destabilizing and non-destabilizing residues. b Description of local pairwise methylation discordance calculation. c Comparison of genomewide LPMD between different DNMT3A mutation subclasses in diagnosis and relapse AML samples from Li2016 cohort. Statistical significances from two-sided Mann–Whitney U tests between DNMT3AWT and DNMT3AINS subclasses are shown. d Schematic diagram illustrating the multiple linear regression analysis predicting LPMD values based on mutation status, age and gender. e Accuracy of LPMD values predicted by multiple linear regression analysis. f Coefficients and significances of regression coefficients. g Correlation between DNMT3A stability score and genomewide LPMD in Li2016 cohort. Pearson’s correlation coefficient and corresponding p value is shown. h Array-based LPMD of TCGA-LAML samples. Bars denote 95% confidence intervals. P values from two-sided Mann–Whitney U tests are shown. i Correlation between DNMT3A stability score and genomewide LPMD in TCGA-LAML cohort. Pearson’s correlation coefficient and corresponding p value is shown. j Genomewide LPMD comparison in SNUH cohort. In (c, f), ***p < 0.001, **p < 0.01, *p < 0.05, two-sided Mann–Whitney U test; In (f), CEBPA-sm, CEBPA with single mutation; CEBPA-dm, CEBPA with double mutation; In (g, i, j), shades denote 95% confidence intervals; For boxplots, the center line denotes the median, the upper and lower box limits denote upper and lower quartiles, and the whiskers denote 1.5× interquartile range.Fig. 2 Methylomes of DNMT3AINS AMLs are similar to DNMT3AWT AMLs, but not to that of DNMT3AR882. a Distribution of average methylation level difference in DMRs identified between DNMT3AR882 and DNMT3AWT AMLs. b Average methylation levels of different DNMT3A mutation subclasses of AMLs around the hypo-DMRs identified between DNMT3AR882 and DNMT3AWT AMLs. c Distribution of average methylation level difference in DMRs identified between different DNMT3A mutation subclsses and normal bone marrow cells using RRBS. d Average methylation levels surrounding the hyper-DMRs in DNMT3AINS (vs normal bone marrow cells) for each DNMT3A mutation subclass. Hypo-DMRs, Hypomethylated DMRs; Hyper-DMRs, Hypermethylated DMRs. In (b, d), shades denote 95% confidence intervals.Fig. 3 Local disorder of methylation in DNMT3AINS AML occurs predominantly at bivalent domains. a Average histone modification levels around hyper-DMR identified between DNMT3AINS and normal bone marrow cells. Shades denote standard errors. b ChromHMM chromatin context enrichment of hyper-DMR identified between DNMT3AINS and normal bone marrow cells. c Average methylation level surrounding bivalent domains. d LPMD distribution across different genomic contexts for Li2016 cohort. Parenthesized values denote the proportion of the analyzed CpGs within each genomic context, except for that next to ‘All’, which denote the total number of analyzed CpGs. P-values from two-sided Mann–Whitney U tests between DNMT3AWT and DNMT3AINS are shown. LPMD distributions in (e) bivalent domain and (f) SINE. P values from two-sided Mann–Whitney U tests between DNMT3AWT and DNMT3AINS are shown. n.s. p > 0.05. g LPMD comparison in bivalent or non-bivalent promoters. P-values from two-sided Mann–Whitney U tests between DNMT3AWT and DNMT3AINS are shown. Throughout (d–g), the center line denotes the median, the upper and lower box limits denote upper and lower quartiles, and the whiskers denote 1.5× interquartile range.Fig. 4 Functional implications of local disorder of DNA methylation and concomitant epigenetic diversity in AML. a Epipolymorphism distribution across different genomic contexts. P values from two-sided Mann–Whitney U tests between DNMT3AWT and DNMT3AINS are shown. The center line denotes the median, the upper and lower box limits denote upper and lower quartiles, and the whiskers denote 1.5× interquartile range. b Experimental scheme to identify genes with methylation disorder-associated inter-sample expression variation. c Association between promoter bivalency and variable gene expression. Values in the table denote the number of genes in the corresponding condition. Odds ratio and p value from two-sided Fisher’s exact test are shown. Functional enrichment of top 4000 genes showing highest inter-sample expression variation in fourth quartile (Q4) of LPMD values for (d) GO Biological Process, (e) GO Cellular Component, and (f) GO Molecular Function terms. Bars represent Benjamini-Hochberg adjusted p values from two-sided Fisher’s exact tests. In (d), GO terms are grouped by broader biological concepts that are shown on the right side. g Gene expression levels (in TPM) and their inter-sample coefficient of variation (CV) for eight representative genes. Samples were grouped according to LPMD quartiles; Q1 (n = 10), Q2 (n = 9), Q3 (n = 9) and Q4 (n = 10).Fig. 5 DNA methylation discordance at bivalent domain correlates with HMA responses of AML cells. a Correlation between LPMD at bivalent domains (bivLPMD) and area under dose-response curve (AUDRC) for hypomethylating agents. Pearsons’s correlation coefficients and corresponding p-values are shown. b Example dose-response curves for RG-108 and decitabine for two representative cell lines, THP1 and HEL9217, with low bivLPMD and high bivLPMD, respectively. c Correlation between LPMD at SINE and AUDRC for hypomethylating agents. Pearsons’s correlation coefficients and corresponding p-values are shown. d Example dose-response curves for RG-108 and decitabine for two representative cell lines, KASUMI1 and SIGM5, with low and high LPMD at SINE, respectively. e Correlation between average methylation level at bivalent domain and AUDRC. Pearsons’s correlation coefficients and corresponding p values are shown. f Schematic diagram showing the retrospective analysis examining the utility of bivLPMD as a biomarker predicting hypomethylating agent (HMA) response. g Comparison of bivLPMD values in AML patient groups showing complete remission or not after HMA treatment. The center line denotes the median, the upper and lower box limits denote upper and lower quartiles, and the whiskers denote 1.5× interquartile range. P value from two-sided Mann–Whitney U test is shown. EM-seq, enzymatic methyl-seq.Fig. 6 Clinical implication of DNMT3AINS in hematological conditions. a Survival analysis for AML patients with different DNMT3A mutation subclasses. b Two-sided multivariate Cox proportional-hazards regression results. Bars denote 95% confidence intervals. HR hazard ratio.Fig. 7 Proposed model explaining the DNA methylation disorder induced by mutant DNMT3AINS and its clinical implications. Proteasomal degradation of destablized DNMT3A proteins harboring DNMT3AINS mutations leads to decreased effective concentration of intracellular DNMT3A. Thus, the dimerization of DNMT3A protein is preferred over their tetramerization. Unlike DNMT3A tetramers, which conduct de novo methylation in a processive manner, DNMT3A dimers dissociate from DNA frequently during catalysis. This distributive de novo methylation results in stochastic local disorder of DNA methylation patterns, which in turn confers population-level epigenetic diversity of hematopoietic stem cells. Increased epigenetic diversity of cell population translates to increased fitness or adaptive potential of cell population, ultimately leading to poorer outcome of the patients.
그림 출처: PubMed Central 공개 논문 (PMC11724044)
Conflict of interest statement
Competing interests: Y.K. is the founder and CEO of Genome Opinion. C.H.S. is the executive director and owns stock in Genome Opinion. The other authors declare no competing interests.
그 밖의 정보
출판 형태
Journal Article
저널
Nature communications · eISSN 2041-1723
전자 출판
2025-01-10
MeSH
Humans · DNA Methyltransferase 3A · Leukemia, Myeloid, Acute* / genetics / pathology · DNA Methylation* / genetics · DNA (Cytosine-5-)-Methyltransferases* / genetics / metabolism · Mutation · Epigenesis, Genetic · Male · Female
Substances
DNA Methyltransferase 3A · DNMT3A protein, human · DNA (Cytosine-5-)-Methyltransferases