
World Allergy Organ J. 2022;15(2):100628.
Phenotypic clusters on computed tomography reflects asthma heterogeneity and severity.
제1저자 김수정, 최상훈 · 교신저자 강혜련, 이창현
소속 (7)
- Division of Allergy and Clinical Immunology, Department of Internal Medicine, School of Medicine, Kyungpook National University, Daegu, South Korea.
- School of Mechanical Engineering, Kyungpook National University, Daegu, South Korea.
- Department of Radiology, SMG-SNU Boramae Medical Center, Seoul, South Korea.
- Institute of Allergy and Clinical Immunology, Seoul National University Medical Research Center, Seoul, South Korea.
- Department of Internal Medicine, Seoul National University College of Medicine, Seoul National University Hospital, Seoul, South Korea.
- Department of Radiology, Seoul National University College of Medicine, Seoul National University Hospital, Seoul, South Korea.
- Institute of Radiation Medicine, Seoul National University Medical Research Center, Seoul, South Korea.
Abstract
BACKGROUND Asthma is a heterogeneous inflammatory airway disorder with various phenotypes. Quantitative computed tomography (QCT) methods can differentiate among lung diseases through accurate assessment of the location, extent, and severity of the disease. The purpose of this study was to identify asthma clusters using QCT metrics of airway and parenchymal structure, and to identify associations with visual analyses conducted by radiologists.
METHODS This prospective study used input from QCT-based metrics including hydraulic diameter (D h), luminal wall thickness (WT), functional small airway disease (fSAD), and emphysematous lung (Emph) to perform a cluster analysis and made comparisons with the visual grouping analysis conducted by radiologists based on site of airway involvement and remodeling evaluated.
RESULTS A total of 61 asthmatics of varying severities were grouped into 4 clusters. From C1 to C4, more severe lung function deterioration, higher fixed obstruction rate, and more frequent asthma exacerbations were observed in the 5-year follow-up period. C1 presented non-severe asthma with increased WT, D h of proximal airways, and fSAD. C2 was mixed with non-severe and severe asthmatics, and showed bronchodilator responses limited to the proximal airways. C3 and C4 included severe asthmatics that showed a reduced D h of the proximal airway and diminished bronchodilator responses. While C3 was characterized by severe allergic asthma without fSAD, C4 included ex-smokers with high fSAD% and Emph%. These clusters correlated well with the grouping done by radiologists and clinical outcomes.
CONCLUSIONS Four QCT imaging-based clusters with distinct structural and functional changes in proximal and small airways can stratify heterogeneous asthmatics and can be a complementary tool to predict clinical outcomes.
© 2022 The Authors.
Keywords
Airway remodelingAsthmaPhenotypeTomographyX-ray computed
Figures
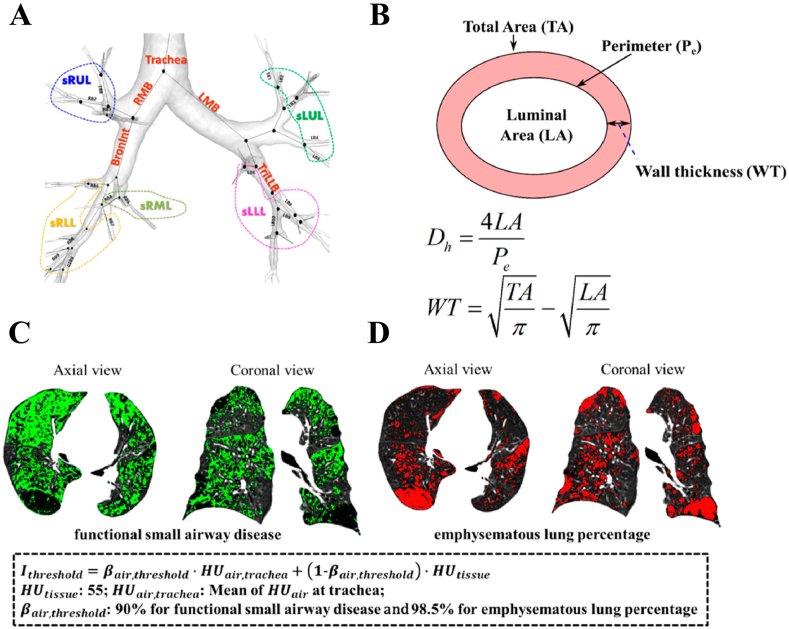
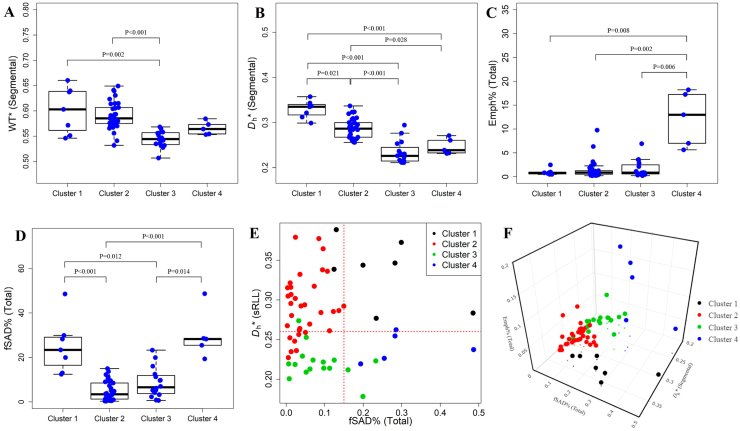
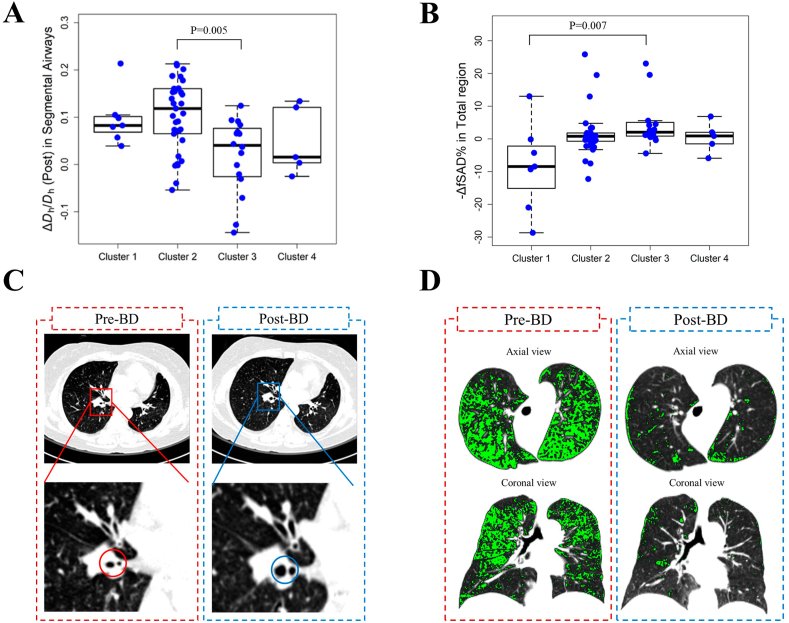
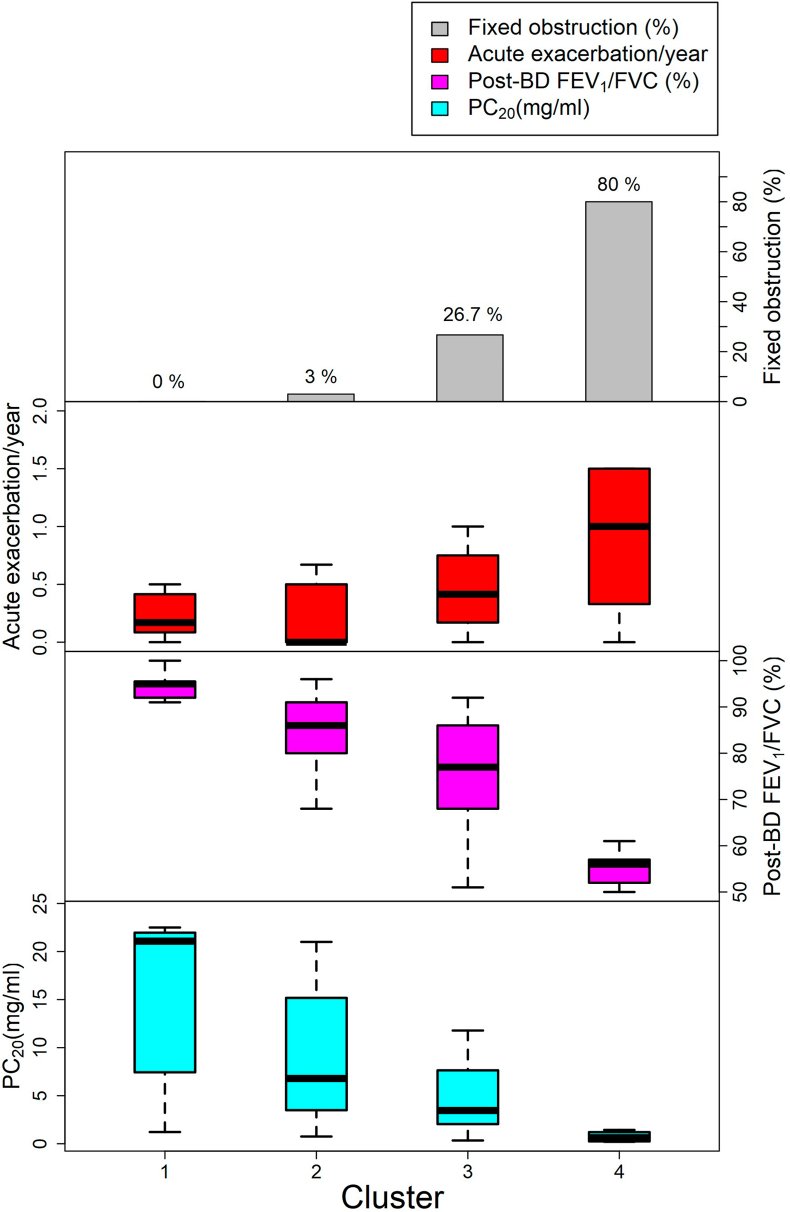
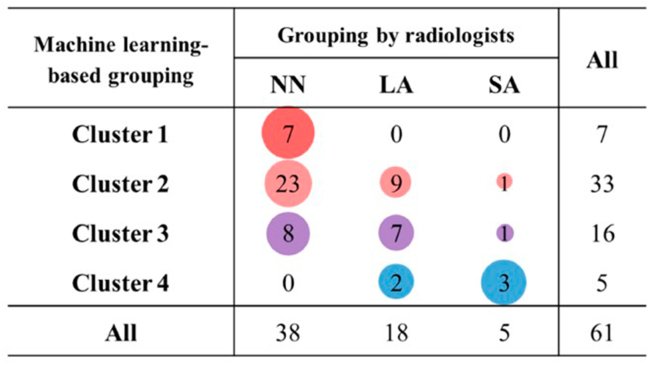
그림 출처: PubMed Central 공개 논문 (PMC9419448)
Conflict of interest statement
The authors declare no conflict of interest.
그 밖의 정보
- 출판 형태
- Journal Article
- 저널
- The World Allergy Organization journal · ISSN 1939-4551
- 전자 출판
- 2022-02-05
- 참고문헌
- 41편