
Sci Rep. 2025;15(1):35659.
Development of a serum protein biomarker panel for the diagnosis of pancreatic ductal adenocarcinoma using a machine learning approach.
제1저자 신동우 · 교신저자 황진혁
소속 (8)
- Department of Translational Medicine, Seoul National University College of Medicine, Seoul, 03080, Republic of Korea.
- Department of Internal Medicine, Hallym University Sacred Heart Hospital, Anyang, Gyeonggi-do, 14068, Republic of Korea.
- Department of Biochemistry, College of Veterinary Medicine, BK 21 PLUS, Seoul National University, Seoul, 08826, Republic of Korea.
- Department of Thoracic and Cardiovascular Surgery, Seoul National University Bundang Hospital, Seongnam, Gyeonggi-do, 13620, Republic of Korea.
- Department of Thoracic and Cardiovascular Surgery, Seoul National University College of Medicine, Seoul, 03080, Republic of Korea.
- Department of Internal Medicine, Seoul National University Bundang Hospital, 82 Gumi-ro 173 Beon-gil, Bundang-gu, Seongnam, Gyeonggi-do, 13620, Republic of Korea.
- Department of Internal Medicine, Seoul National University Bundang Hospital, 82 Gumi-ro 173 Beon-gil, Bundang-gu, Seongnam, Gyeonggi-do, 13620, Republic of Korea. woltoong@snu.ac.kr.
- Department of Internal Medicine, Seoul National University College of Medicine, Seoul, 03080, Republic of Korea. woltoong@snu.ac.kr.
Abstract
Early detection of pancreatic ductal adenocarcinoma (PDA) remains a major clinical challenge due to the lack of reliable biomarkers. We developed and validated a machine learning (ML)-based serum protein biomarker panel to enhance PDA diagnosis. Serum concentrations of 47 protein biomarkers were measured in 355 individuals using a Luminex™ bead-based immunoassay. Multiple ML algorithms were employed to construct a diagnostic model, with SHapley Additive exPlanations (SHAP) analysis used to determine the importance of each biomarker. The diagnostic performance of the panel was assessed by the area under the receiver operating characteristic curve (AUROC), F1 score, sensitivity, specificity, and accuracy, and further validated in an independent cohort of 130 individuals. Among the tested models, CatBoost demonstrated the highest diagnostic accuracy. SHAP analysis identified CA19-9, GDF15, and suPAR as key biomarkers, and the combined panel significantly outperformed CA19-9 alone in detecting PDA across all stages (AUROC 0.992 vs. 0.952) and in early-stage PDA (AUROC 0.976 vs. 0.868). Validation in another cohort confirmed the robustness of the model, with AUROC values of 0.977 for all stages and 0.987 for early-stage PDA. These findings suggest that ML-integrated biomarker panels may enable earlier and more accurate PDA detection in clinical practice.
© 2025. The Author(s).
Keywords
BiomarkersDiagnosisMachine learningPancreatic cancerProteomics
Figures
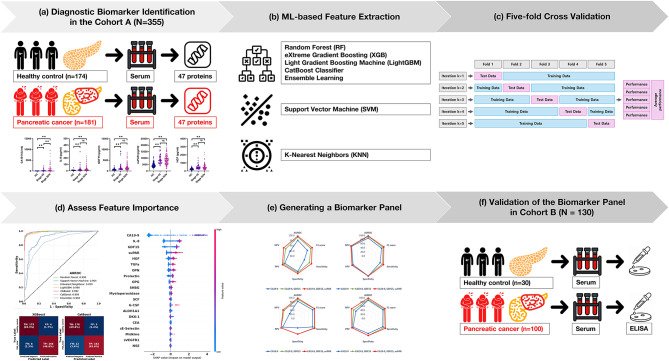
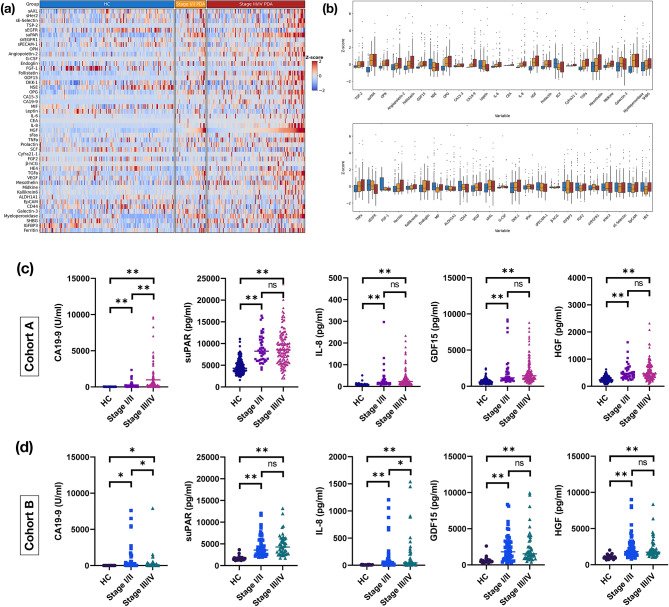
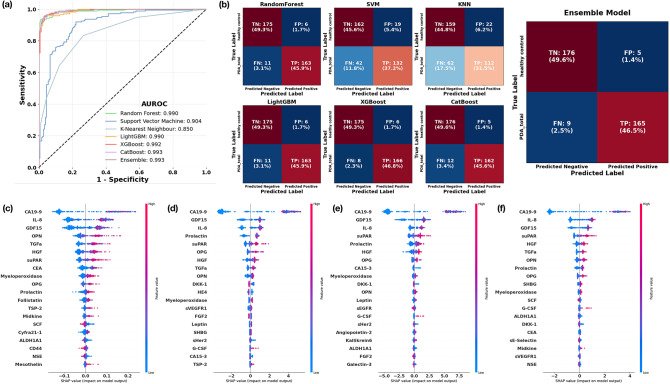
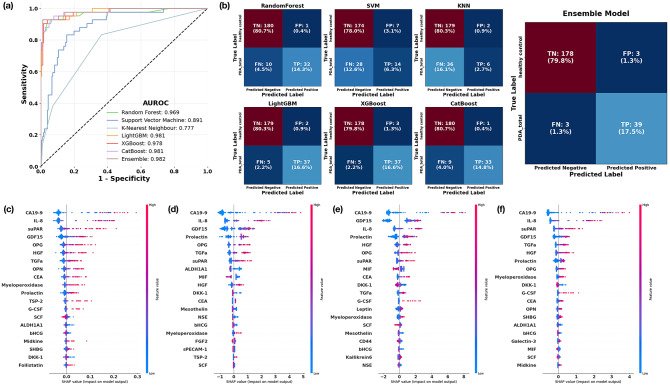
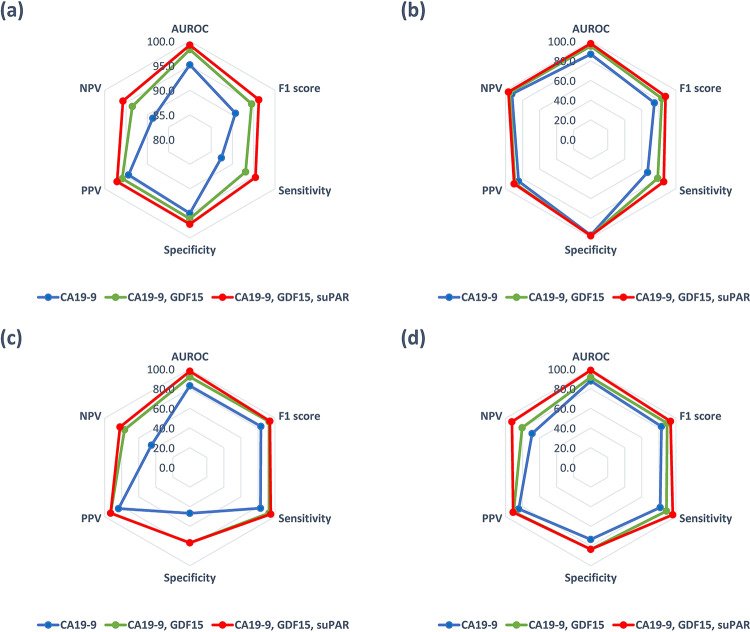
그림 출처: PubMed Central 공개 논문 (PMC12518602)
Conflict of interest statement
Declarations. Competing interests: The authors declare no competing interests.
그 밖의 정보
- 출판 형태
- Journal Article
- 저널
- Scientific reports · eISSN 2045-2322
- 전자 출판
- 2025-10-13
- MeSH
- Humans · Machine Learning* · Carcinoma, Pancreatic Ductal* / diagnosis / blood · Biomarkers, Tumor* / blood · Female · Pancreatic Neoplasms* / diagnosis / blood · Male · Middle Aged · Aged · ROC Curve · CA-19-9 Antigen / blood · Blood Proteins* / analysis · Early Detection of Cancer / methods · Growth Differentiation Factor 15 / blood · Adult
- Substances
- Biomarkers, Tumor · CA-19-9 Antigen · Blood Proteins · Growth Differentiation Factor 15
- 연구비
- Seoul National University Bundang Hospital 14-2021-0042, 06-2020-0113
- 참고문헌
- 86편