Department of Otorhinolaryngology-Head and Neck Surgery, Soonchunhyang University College of Medicine, Cheonan, Korea.
Department of Internal Medicine, Seoul National University College of Medicine, 101 Daehak-ro, Jongno-gu, Seoul, 03080, Korea.
Department of Otorhinolaryngology, Seoul National University College of Medicine, 103 Daehak-ro, Jongno-gu, Seoul, 03080, Korea.
Department of Pathology, Seoul National University College of Medicine, Seoul, Korea.
Department of Internal Medicine, Seoul National University College of Medicine, 101 Daehak-ro, Jongno-gu, Seoul, 03080, Korea. wbpark1@snu.ac.kr.
Department of Otorhinolaryngology, Seoul National University College of Medicine, 103 Daehak-ro, Jongno-gu, Seoul, 03080, Korea. hyunjerry@snu.ac.kr.
Sensory Organ Research Institute, Seoul National University Medical Research Center, Seoul, Korea. hyunjerry@snu.ac.kr.
Abstract
While severe acute respiratory syndrome coronavirus-2 (SARS-CoV-2) is characterized by impaired induction of interferons (IFNs) and IFN-stimulated genes (ISGs), the IFNs and ISGs in upper airway is essential to restrict the spread of respiratory virus. Here, we identified the prominent IFN and ISG upregulation in the nasopharynx (NP) of mild and even severe coronavirus disease 2019 (COVID-19) patients (CoV2+) in Omicron era and to compare their clinical outcome depending on the level of IFNs and ISGs. Whereas the induction of IFNB was minimal, transcription of IFNA, IFNG, and IFNLs was significantly increased in the NP of CoV2 + patients. IFNs and ISGs may be more upregulated in the NP of CoV2 + patients at early phases of infection according to viral RNA levels and this is observed even in severe cases. IFN-related innate immune response might be characteristic in macrophages and monocytes at the NP and the CoV2 + patients with higher transcription of IFNs and ISGs in the NP showed a correlation with good prognosis of COVID-19. This study presents that IFNs and ISGs may be upregulated in the NP, even in severe CoV2 + patients depending on viral replication during Omicron-dominant period and the unique IFN-responsiveness in the NP links with COVID-19 clinical outcomes.
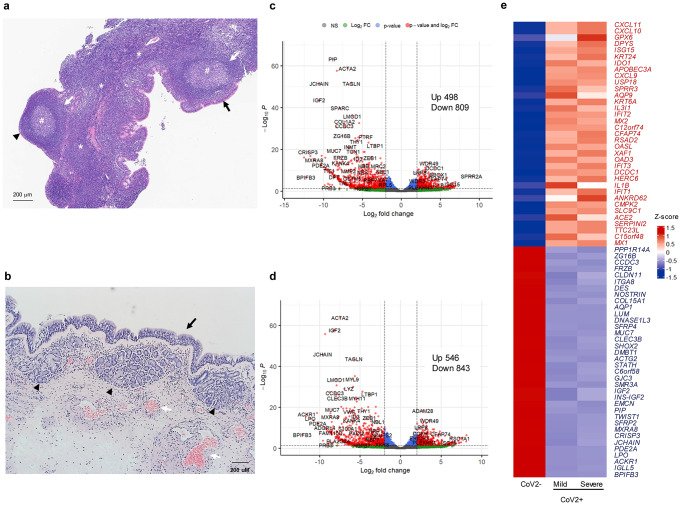
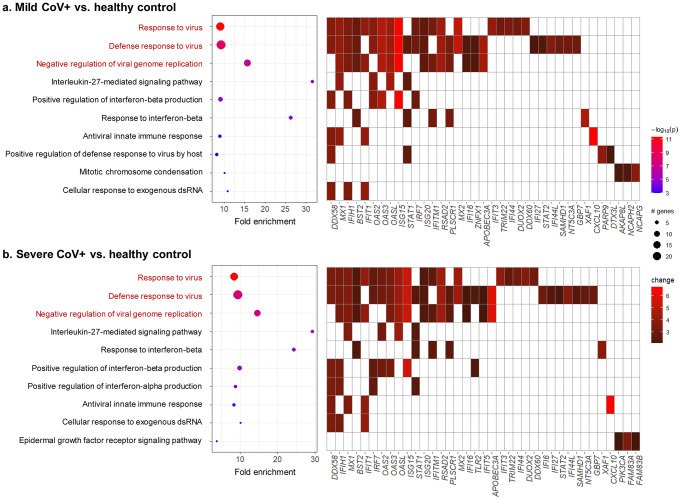
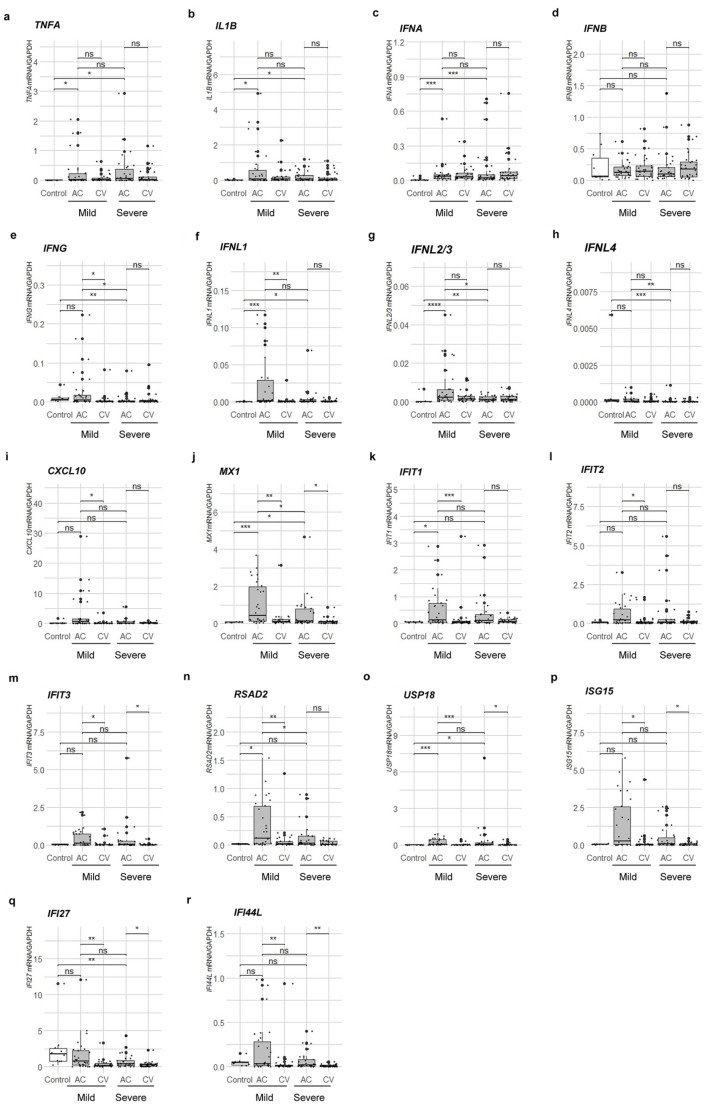
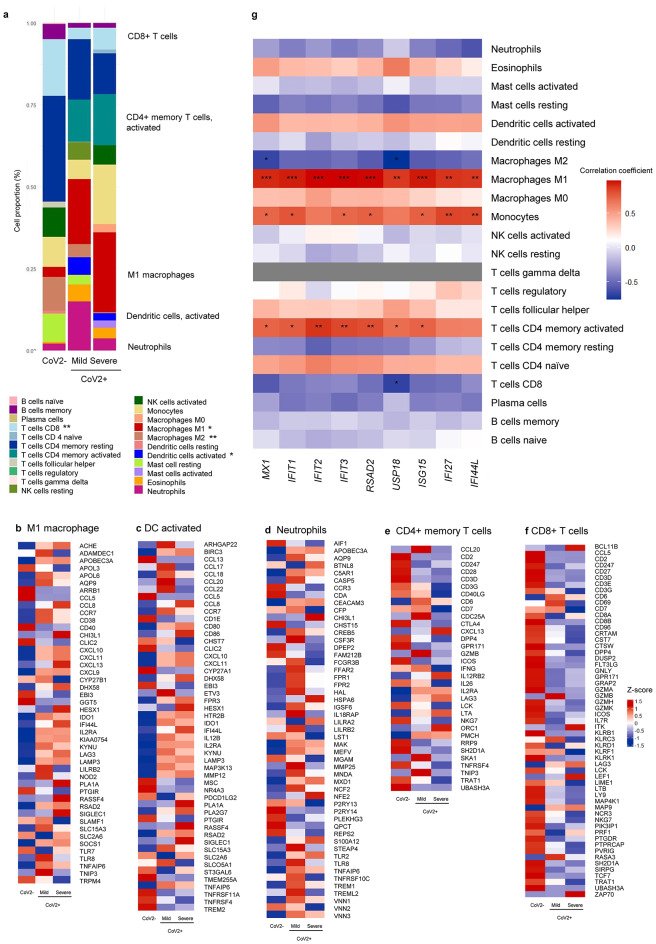
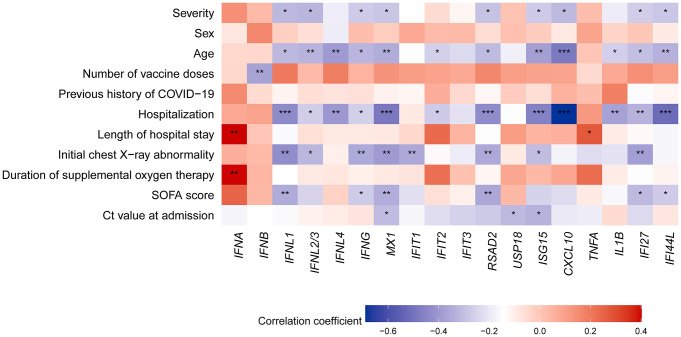
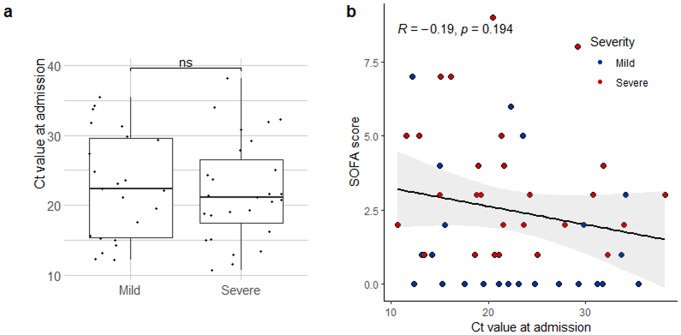
Fig. 1Histologic findings of NP and nasal mucosa and differentially expressed genes and cell proportions in RNA-seq datasets of CoV2 + patients. (a) The patient’s nasopharyngeal lymphoid tissue was observed and sampled through an intranasal endoscope by an ENT specialist. The histologic structure of hematoxylin and eosin–stained NP lymphoid tissue. Pseudostratified columnar epithelium (black arrow), squamous epithelium (black triangle), enlarged lymphoid follicles (white arrow), germinal center (#), and intercellular T cell zones (*) were characteristic of NP lymphoid tissue. Scale bar; 100 µM. (b) Histologic structure of hematoxylin and eosin–stained nasal mucosa. Pseudostratified columnar epithelium (black arrow), submucous glands (black triangle), and venous sinusoid (white arrow) were characteristic of nasal mucosa. Scale bar; 200 µM. The histologic results are representative of NP tissues and nasal mucosa from three adults. (c) Volcano plot of regulated genes on nasopharyngeal swabs of 3 mild-CoV2 + patients and 3 healthy controls. Cut-off values of differentially expressed genes are log2-fold change > |2.0| and adjusted p < 0.05. (d) Regulated genes on nasopharyngeal swabs of 3 severe-CoV2 + patients and 3 healthy controls. Cut-off values of differentially expressed genes are log2-fold change > |2.0| and adjusted p < 0.05. (e) Heatmap of average differentially expressed genes of controls, mild, and severe CoV2 + patients. The 35 most common upregulated and downregulated genes of CoV2 + patients compared with controls (n = 3 for each group)Fig. 2Enrichment analysis of CoV2 + patients compared to healthy controls using gene ontology–biological process gene sets (n = 3 for each group). (a) An enrichment chart and a term gene heatmap of mild-CoV2 + patients (n = 3). (b) An enrichment chart and a term gene heatmap of severe-CoV2 + patients (n = 3). Enriched terms were filtered by an adjusted p value < 0.05 (Bonferroni method)Fig. 3mRNA transcription levels of IFNs and ISGs, including (a) TNFA, (b) IL1B, (d) IFNA, (d) IFNB, (e) IFNG, (f) IFNL1, (g) IFNL2/3, (h) IFNL4, (i) CXCL10, (j) MX1, (k) IFIT1, (l) IFIT2, (m) IFIT3, (n) RSAD2, (o) USP18, (p) ISG15, (q) IFI27, and (r) IFI44L, were assessed in the control group, as well as in mild and severe patients during both the acute and convalescent phases (mean ± SEM; Mann-Whitney test; n = 10 for control, n = 30 for each CoV + group). All mRNA transcription levels were normalized to that of GAPDH. The significance levels are represented as follows: ns indicates p value > 0.05, * indicates p value < 0.05, ** indicates p value < 0.01, *** indicates p value < 0.001, and **** indicates p value < 0.0001Fig. 4Average immune cell proportions and related DEGs among controls and CoV2 + patients (n = 3 for each group). (a) Average immune cell proportions for controls, mild-, and severe-CoV2 + patients (t-test). M1 and DCs are significantly elevated in CoV2 + patients. DEGs for (b) M1 macrophage, (c) Dendritic cells activated, (d) Neutrophils, (e) CD4 memory T cells (activated), (f) CD8 T cells according to LM22 were shown as heatmap. (g) Pearson correlation test between immune cell proportions of each sample and ISGs demonstrated the relevance of M1 macrophages and monocytes with ISGs. MX1,IFIT1,IFIT2,IFIT3,RSAD2,USP18,ISG15,IFI27, and IFI44L were log-transformed due to skewed distribution. The significance levels are represented as follows: * indicates p value < 0.05, ** indicates p value < 0.01, and *** indicates p value < 0.001Fig. 5A heatmap of the correlations between clinical factors and markers of innate immune responses (n = 60). IFNs and ISGs were log-transformed for normalization. Pearson correlation test (point-biserial correlation test for binary variables) was performed. The significance levels are represented as follows: * indicates p value < 0.05, ** indicates p value < 0.01, and *** indicates p value < 0.001Fig. 6Relationships between the Ct value at admission and the severity and innate immune response markers (mild n = 23, severe n = 28). (a) The Ct value at admission showed no difference between mild and severe-CoV2 + patients. The 2-tailed t-test was used to compare each group. ns indicates p > 0.05. Error bars indicate the SEM. (b) There was no significant correlation between the Ct value at admission and SOFA score (Pearson test)
그림 출처: PubMed Central 공개 논문 (PMC11342914)
Conflict of interest statement
The authors declare that the research was conducted in the absence of any commercial or financial relationships that could be construed as potential conflicts of interest.
그 밖의 정보
출판 형태
Journal Article
저널
Cellular and molecular life sciences : CMLS · eISSN 1420-9071