
Clin Kidney J. 2021;14(5):1356-1363.
The minimum-mortality estimated glomerular filtration rate percentile shifts upward in the aged population: a nationwide population-based study.
제1저자 김예림 · 교신저자 김동기, 한경도
소속 (7)
- Department of Internal Medicine, Keimyung University School of Medicine, Daegu, Korea.
- Department of Internal Medicine, Seoul National University Hospital, Seoul, Korea.
- Department of Biomedical Sciences, Seoul National University College of Medicine, Seoul, Korea.
- Department of Internal Medicine, Armed Forces Capital Hospital, Gyeonggi-do, Korea.
- Department of Medical Statistics, College of Medicine, Catholic University of Korea, Seoul, Korea.
- Department of Internal Medicine, SMG-SNU Boramae Medical Center, Seoul, Korea.
- Department of Statistics and Actuarial Science, Soongsil University, Seoul, Korea.
Abstract
BACKGROUND The estimated glomerular filtration rate (eGFR) is a biomarker not only for kidney function, but also for major clinical outcomes. We aimed to evaluate the patterns of mortality across the entire eGFR percentile spectrum using a population-based dataset.
METHODS We retrospectively reviewed the National Health Insurance Service (NHIS) database for people who received nationwide health check-ups from 2009 to 2012. Subjects who were ≥45 years old and had one or more serum creatinine values available were included in the study. The primary outcome was all-cause mortality as a function of eGFR percentile.
RESULTS The middle-aged group (45-64 years) showed a U-shaped pattern of association between eGFR percentile and all-cause mortality. The minimum-mortality eGFR percentile was shifted upward in the elderly group (≥65 years). Specifically, the minimum-mortality eGFR percentiles were the 28th percentile (83.8 mL/min/1.73 m2) for middle-aged males, the 63rd percentile (86.2 mL/min/1.73 m2) for elderly males, the 42nd percentile (102.8 mL/min/1.73 m2) for middle-aged females and the 75th percentile (90.1 mL/min/1.73 m2) for elderly females. Diabetes and hypertension shifted the minimum-mortality eGFR percentile upward in the middle-aged group. This pattern was attenuated in the elderly group.
CONCLUSIONS The eGFR percentile showing minimum mortality moves upward in the aged population as well as patients with diabetes and hypertension, which might reduce the clinical significance of hyperfiltration. Risk stratification for mortality should be approached differently according to the specific conditions of the patient group.
© The Author(s) 2020. Published by Oxford University Press on behalf of ERA-EDTA.
Keywords
all-cause mortalityelderlyestimated glomerular filtration rate
Figures
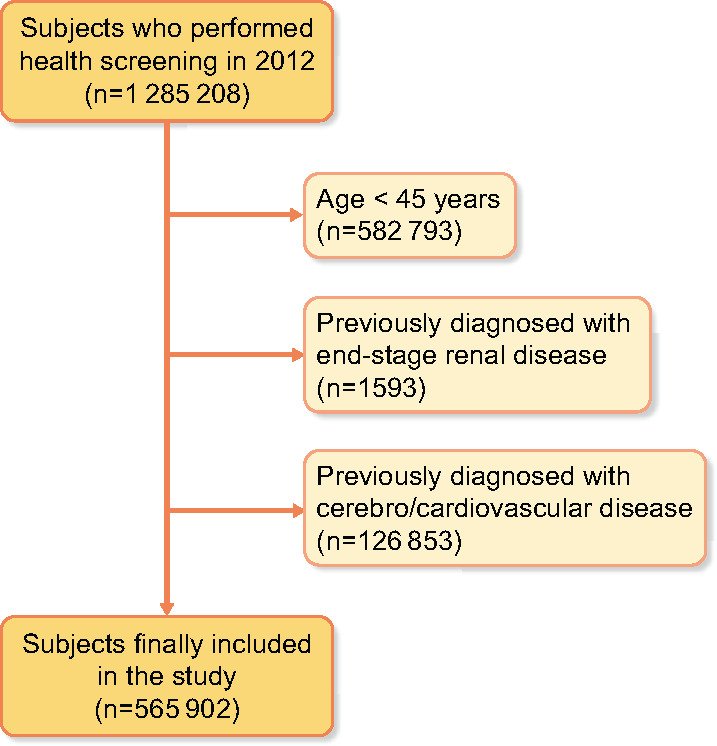
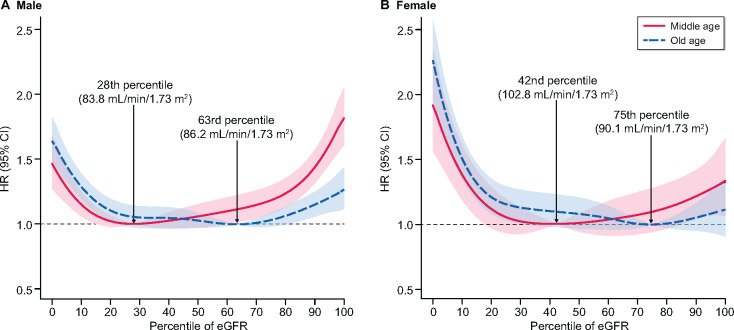
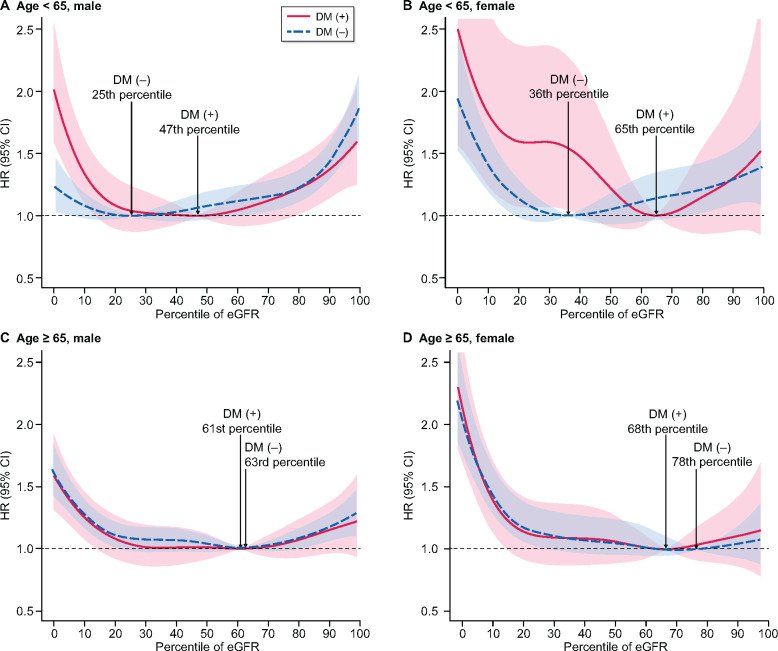
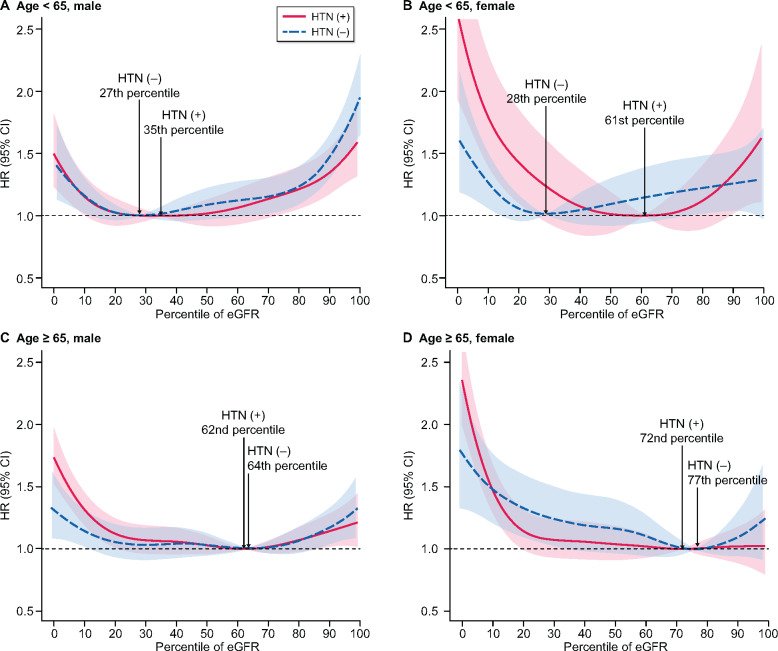
그림 출처: PubMed Central 공개 논문 (PMC8087142)
그 밖의 정보
- 출판 형태
- Journal Article
- 저널
- Clinical kidney journal · ISSN 2048-8505
- 전자 출판
- 2020-12-29
- 참고문헌
- 20편