
PLoS One. 2019;14(4):e0214912.
Bioelectrical impedance analysis as a nutritional assessment tool in Autosomal Dominant Polycystic Kidney Disease.
제1저자 류현진 · 교신저자 오국환, 안규리
소속 (9)
- Department of Internal Medicine, Seoul National University Hospital, Seoul, Korea.
- Department of Internal Medicine, Hallym University Kangnam Sacred Heart Hospital, Seoul, Korea.
- Department of Internal Medicine, Chuncheon Sacred Heart Hospital, Chuncheon, Korea.
- National Assembly Futures Institute, Seoul, South Korea.
- Truewords Dialysis Clinic, Incheon, Korea.
- Department of Radiology, Seoul National University Hospital, Seoul, Korea.
- Department of Internal Medicine, Kangbuk Samsung Hospital, College of Medicine, Sungkyunkwan University, Seoul, Korea.
- Department of Internal Medicine, Seoul National University Boramae Medical Center, Seoul, Korea.
- Department of Internal Medicine, Seoul National University College of Medicine, Seoul, Korea.
Abstract
OBJECTIVE Autosomal dominant polycystic kidney disease (ADPKD) patients with massive organomegaly suffer from pressure-related complications including malnutrition. In this study, we analyzed the efficacy of segmental bioelectrical impedance analysis (BIA) for objective and quantitative nutritional assessment in ADPKD patients.
DESIGN AND METHODS We conducted a cross-sectional study, to evaluate the clinical utility of segmental BIA for assessing the nutritional status of ADPKD patients. BIA measurements was assessed according to modified subjective global assessment (SGA) scores and were compared with data from a healthy population. The association between BIA measurements and the height adjusted kidney and liver volumes (htTKLV), were analyzed.
SUBJECTS A total of 288 ADPKD patients, aged ≥ 18 years old, were analyzed.
MAIN OUTCOME MEASURES Nutritional status was evaluated with SGA and segmental BIA. The htTKLV were measured in each patients using computed tomonography images.
RESULTS Higher ratios of extracellular water to total body water (ECW/TBW) in the whole-body (ECW/TBWWB), trunk (ECW/TBWTR), and lower extremities (ECW/TBWLE) and lower phase angle of lower extremities (PhALE) correlated with lower SGA scores in the ADPKD population and in both gender. The four parameters, ECW/TBWWB, ECW/TBWTR, and ECW/TBWLE of >0.38 and PhALE of <5.8 θ were associated with malnutrition in ADPKD patients. These correlations were preserved in the subgroup analysis for chronic kidney disease stages 1-3A. Compared to healthy populations' data, body fluid parameters and segmental ECW/TBW values, except for the upper extremities (ECW/TBWUE), were greater in ADPKD patients. Increased htTKLV was an independent risk factor for malnutrition in ADPKD. The highest correlation with htTKLV was observed for the ECW/TBWTR (r = 0.466), followed by ECW/TBWWB (r = 0.407), ECW/TBWLE (r = 0.385), PhALE (r = -0.279), and PhATR (r = 0.215).
CONCLUSIONS These results demonstrated that segmental BIA parameters of ECW/TBWWB, ECW/TBWTR, ECW/TBWLE and PhALE provide useful information on nutritional status including the impact of organomegaly in ADPKD.
Figures
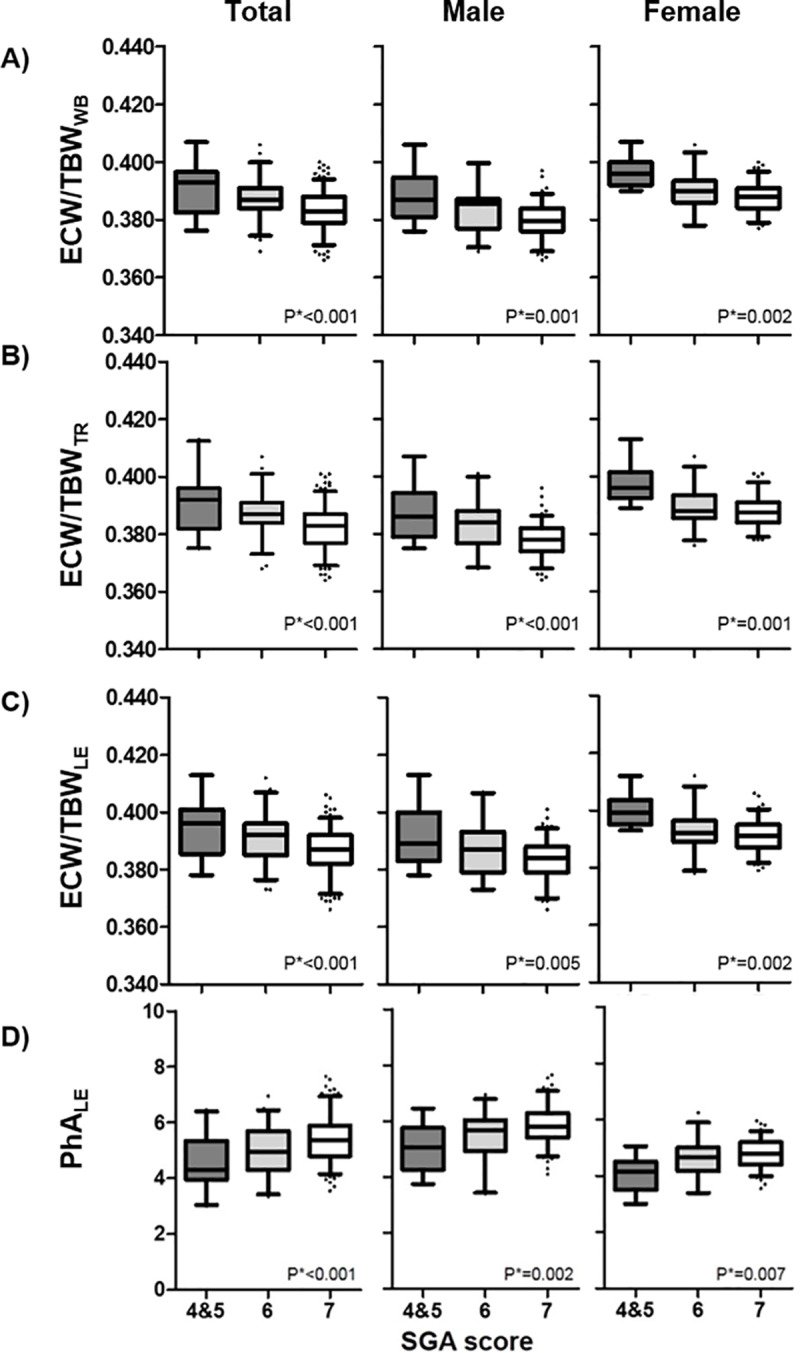
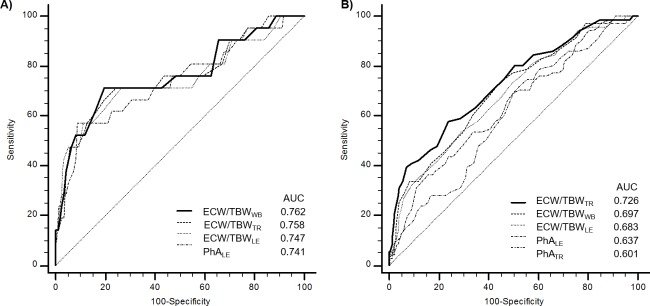
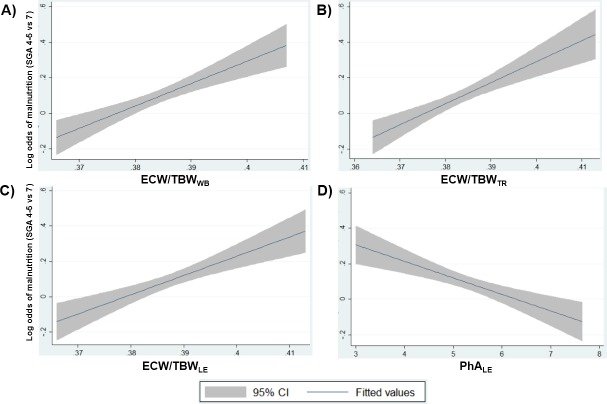
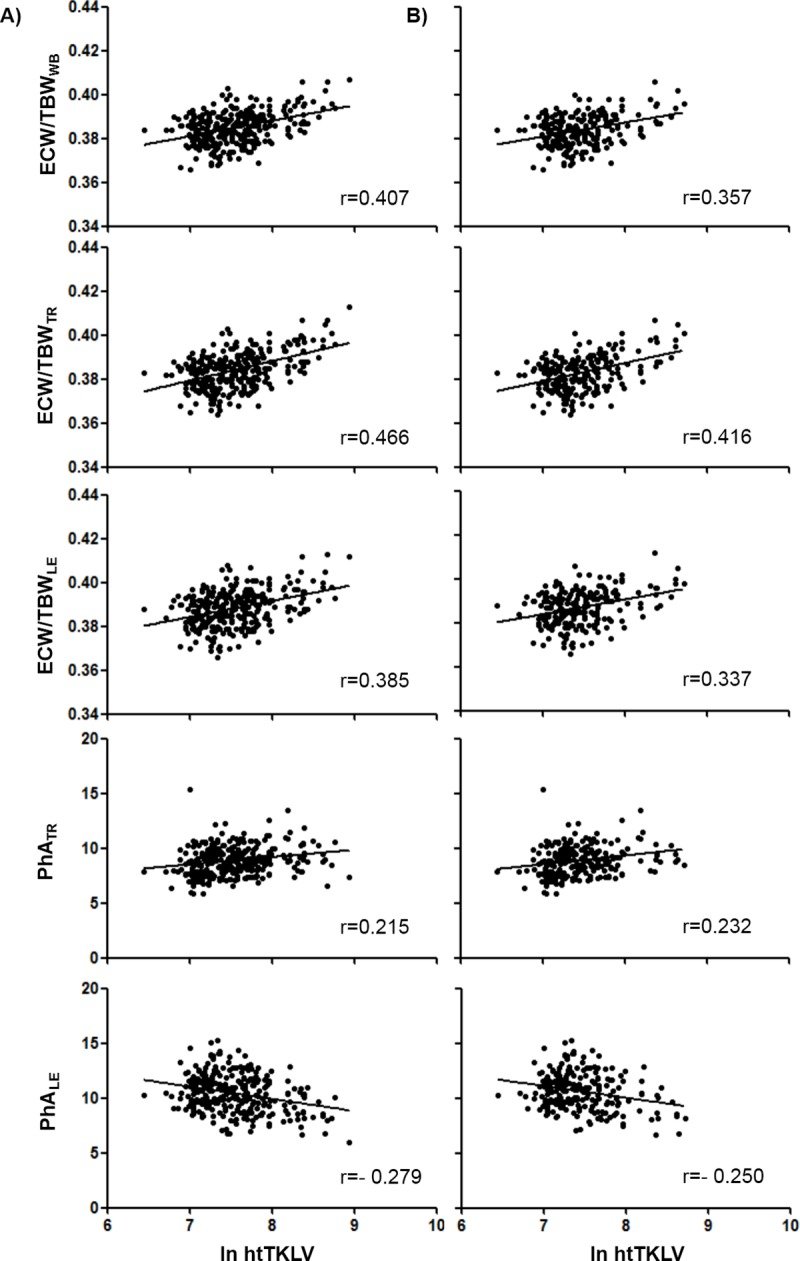
그림 출처: PubMed Central 공개 논문 (PMC6449065)
Conflict of interest statement
The authors have declared that no competing interests exist.
그 밖의 정보
- 출판 형태
- Clinical Trial, Journal Article, Research Support, Non-U.S. Gov't
- 저널
- PloS one · eISSN 1932-6203
- 전자 출판
- 2019-04-04
- MeSH
- Adult · Body Height* · Cross-Sectional Studies · Electric Impedance* · Female · Humans · Kidney / pathology · Liver / pathology · Male · Middle Aged · Nutrition Assessment* · Organ Size · Polycystic Kidney, Autosomal Dominant / pathology · Sex Factors
- 참고문헌
- 41편