INTRODUCTION Statins, hydroxymethylglutaryl-coenzyme A reductase inhibitors, have been reported to have antiinflammatory and/or immunomodulatory effects and prophylactic and therapeutic effects in collagen-induced arthritis, an experimental model of rheumatoid arthritis (RA). The authors undertook to determine the effect of atorvastatin on the expressions of osteoprotegerin (OPG) and receptor activator of nuclear factor κB ligand (RANKL) in RA fibroblast-like synoviocytes (FLSs), to identify the mechanisms responsible for these effects, and to determine whether the statin inhibits osteoclastogenesis.
METHODS FLSs isolated from five RA patients were cultured in the presence of 20 ng/ml of tumor necrosis factor-α (TNF-α) with or without atorvastatin. RANKL expressions were assayed with Western blotting and enzyme-linked immunosorbent assay. RANKL, RANK, and OPG expression were assayed with reverse transcription-polymerase chain reaction (RT-PCR). Osteoclast formation was assayed by counting cells after staining for tartrate-resistant acid phosphatase in cocultures of peripheral blood mononuclear cells (PBMCs) and RA FLSs.
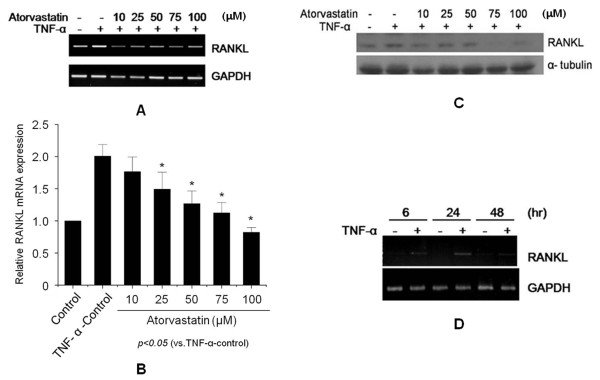
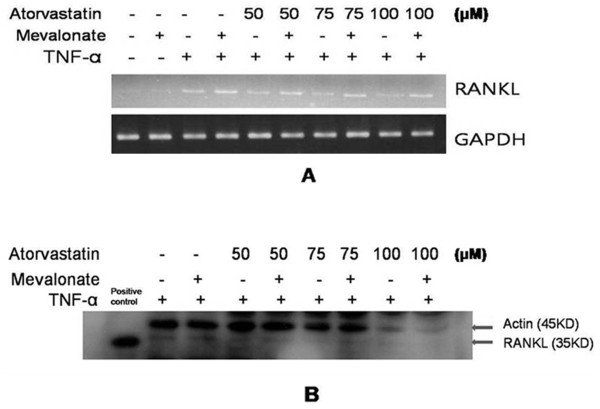
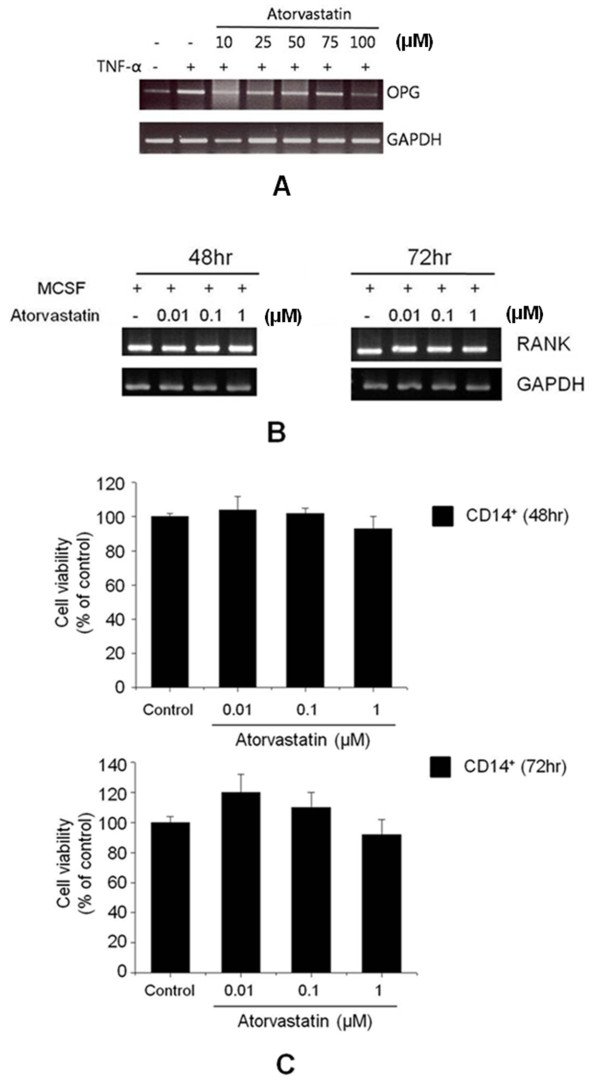
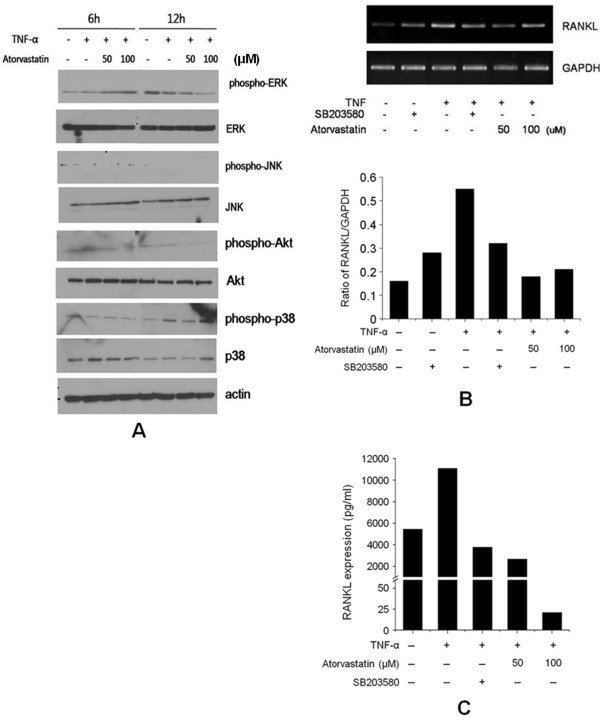
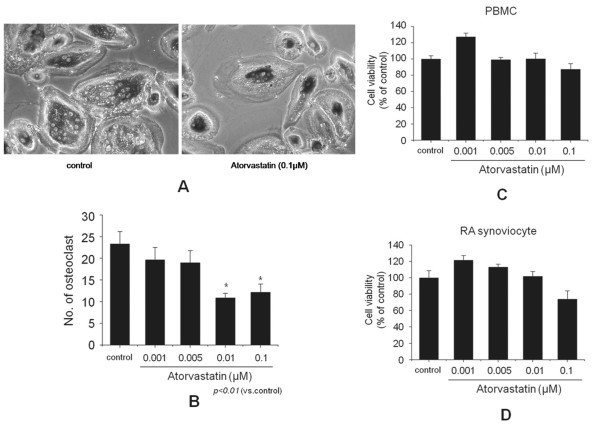
RESULTS Atorvastatin inhibited the expression of RANKL in RA FLSs in a dose-dependent manner, and the suppression of RANKL was prevented by mevalonate. However, OPG expression was not affected by atorvastatin in RA FLSs, and atorvastatin did not affect RANK expression in CD14⁺ cells. Conversely, atorvastatin suppressed TNF-α-induced p38 phosphorylation in RA FLSs and significantly reduced TRAP-positive multinucleated osteoclast formation in the coculture of PBMCs and RA FLSs.
CONCLUSION These results suggest that atorvastatin inhibits osteoclastogenesis and bone destruction in RA patients.
Figures
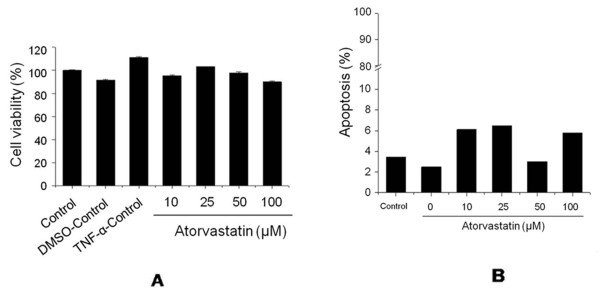
Figure 1Effects of atorvastatin on receptor activator of nuclear factor κB ligand (RANKL) expression in fibroblast-like synoviocytes (FLSs) from rheumatoid arthritis (RA) patients. FLSs were isolated from three RA patients (patients numbers 1, 2, and 3) and cultured in the presence of tumor necrosis factor (TNF)-α (20 ng/ml) with or without atorvastatin for 24 hours. RANKL expressions were analyzed with RT-PCR (A), real-time PCR (B), and Western blotting (C). (D)TNF-α induced expression of RANKL mRNA in the FLSs of RA patients. Total RNA was extracted from FLSs cultured in the absence (-) or in the presence (+) of TNF-α (20 ng/ml) for indicated times. Total RNA was analyzed with RT-PCR. Results are representative of three independent experiments.Figure 2Effects of mevalonate on the statin-induced suppression of RANKL. FLSs from RA patients (patients number 1 through 3) were cultured in the presence of TNF-α (20 ng/ml), and then atorvastatin (50 to 100 μM) and mevalonate (100 μM) were added for 24 hours. RANKL expressions were analyzed with RT-PCR (A)and Western blotting (B). A representative experiment from three independent experiments is shown.Figure 3The effects of atorvastatin on cell viability and apoptosis. (A)Effects of atorvastatin on the viability of FLSs from an RA patient (patients 1, 2, and 3). Cells were cultured for 24 hours in the presence of TNF-α (20 ng/ml) and atorvastatin at different concentrations (10 to 100 μM). Cell viabilities were determined by using MTT assays. (B)Effects of atorvastatin on the apoptosis of FLSs as determined by propidium iodide staining.Figure 4Effects of atorvastatin on osteoprotegerin (OPG) expression in FLSs and RANK expression in CD14+cells of RA patients (patients 1, 4, and 5). (A)RT-PCR was used to analyze OPG mRNA expression in FLSs cultured for 24 hours with 20 ng/ml TNF-α and atorvastatin (10 to 100 μM). The results shown are representative of three independent experiments. (B)CD14+cells were cultured for 48 or 72 hours in the presence of 2 ng/ml of macrophage colony-stimulating factor and different concentrations of atorvastatin (0.01 to 1 μM). RANK mRNA expression was not affected by atorvastatin according to RT-PCR results. (C)Atorvastatin had no effect on the viability of CD14+cells at concentrations up to 1 μM. The results are representative of three independent experiments.Figure 5The effect of atorvastatin on the phosphorylations of ERK, JNK, Akt, and p38 MARK, induced by TNF-α in FLSs from RA patients (patients 1, 4, and 5). (A)FLSs were cultured in the presence of TNF-α (20 ng/ml) with or without atorvastatin (50 to 100 μM) for 24 hours to determine the effect of atorvastatin on the activations of signaling molecules. Phosphorylated ERK, JNK, Akt, and p38 MARK were analyzed by using Western blotting. Representative Western blots from three independent experiments are shown. (B)The effect of atorvastatin on the phosphorylation of p38 MARK induced by TNF-α in FLSs from an RA patient. After serum deprivation for 24 hours, FLSs were cultured with SB203580 (10 μM) for 2 hours. TNF-α (20 ng/ml) and atorvastatin (50 to 100 μM) were then added, and incubation was continued for another 24 hours. The expressions of RANKL mRNA relative to GAPDH were determined with RT-PCR. (C)RANKL secretion was determined with ELISA. Both SB203580 and atorvastatin inhibited RANKL production by TNF-α.Figure 6Effect of atorvastatin on osteoclast formation. (A)Osteoclast formation was assayed with tartrate-resistant acid phosphatase (TRAP) staining and counting positive cells containing three or more nuclei under a light microscope (original magnification, ×100). (B)Peripheral blood mononuclear cells (PBMCs; 2 × 10⁵cells/well) from a healthy donor were cocultured with fibroblast-like synoviocytes from a rheumatoid arthritis patient (RA FLSs; 2 × 10⁴cells/well, patients 1, 4, and 5) in the presence of macrophage colony-stimulating factor, 1,25-dihydroxyvitamin D3, and different concentrations (0.001 to 0.1 μM) of atorvastatin in 96-well plates for 3 weeks. Cell viabilities were assayed in separate cultures of FLSs and PBMCs. (C)PBMCs were cultured for 3 weeks in the presence of 10-7M1,25-dihydroxyvitamin D3and different concentrations of atorvastatin. (D)RA FLSs were cultured for 3 weeks in the presence of 2 ng/ml macrophage colony-stimulating factor and different concentrations of atorvastatin (0.001 to 0.1 μM). Bars represent means and SDs. All experiments were carried out 3 times in triplicate. *P< 0.01 versus control.