
Cancer Med. 2024;13(18):e70238.
Unraveling the impact of lysosomal dysfunction on myeloproliferative neoplasm.
제1저자 윤현동 · 교신저자 윤성수, 고영일
소속 (12)
- Cancer Research Institute, Seoul National University College of Medicine, Seoul, Republic of Korea.
- Bioinformatics Institute, Seoul National University, Seoul, Republic of Korea.
- BK21 FOUR Intelligence Computing, Seoul National University, Seoul, Republic of Korea.
- Interdisciplinary Program in Bioinformatics, Seoul National University, Seoul, Republic of Korea.
- Interdisciplinary Program in Artificial Intelligence, Seoul National University, Seoul, Republic of Korea.
- Division of Hematology/Oncology, Department of Medicine, Vanderbilt University Medical Center, Nashville, Tennessee, USA.
- Department of Computer Science and Engineering, Seoul National University, Seoul, Republic of Korea.
- AIGENDRUG Co., Ltd, Seoul, Republic of Korea.
- MOGAM Institute for Biomedical Research, Green Cross Corp, Yongin, Republic of Korea.
- Department of Genomic Medicine, Seoul National University Hospital, Seoul, Republic of Korea.
- Center for Medical Innovation, Seoul National University Hospital, Seoul, Republic of Korea.
- Department of Internal Medicine, Seoul National University Hospital, Seoul, Republic of Korea.
Abstract
BACKGROUND Lysosomal dysfunction (LD) impacts cytokine regulation, inflammation, and immune responses, influencing the development and progression of cancer. Inflammation is implicated in the pathogenesis of myeloproliferative neoplasm (MPN). With a hypothesis that LD significantly contributes to MPN carcinogenesis by inducing abnormal inflammation, our objective was to elucidate the pathophysiological mechanisms of MPN arising from an LD background.
METHODS Genotyping of the LD background was performed in a cohort of MPN patients (n = 190) and healthy controls (n = 461). Logistic regression modeling, utilizing genotype data, was employed to estimate the correlation between LD and MPN. Whole transcriptome sequencing (WTS) (LD carriers = 8, non-carriers = 6) and single-cell RNA sequencing data (LD carriers = 2, non-carriers = 2, healthy controls = 2) were generated and analyzed.
RESULTS A higher variant frequency of LD was observed in MPN compared to healthy controls (healthy, 4.9%; MPN, 7.8%), with the highest frequency seen in polycythemia vera (PV) (odds ratio = 2.33, p = 0.03). WTS revealed that LD carriers exhibited upregulated inflammatory cytokine ligand-receptor genes, pathways, and network modules in MPNs compared to non-carriers. At the single-cell level, there was monocyte expansion and elevation of cytokine ligand-receptor interactions, inflammatory transcription factors, and network modules centered on monocytes. Notably, Oncostatin-M (OSM) consistently emerged as a candidate molecule involved in the pathogenesis of LD-related PV.
CONCLUSIONS In summary, an LD background is prevalent in MPN patients and leads to increased cytokine dysregulation and inflammation. OSM, as one of the potential molecules, plays a crucial role in PV pathogenesis by impairing lysosomal function.
© 2024 The Author(s). Cancer Medicine published by John Wiley & Sons Ltd.
Keywords
Oncostatin‐Mcytokine dysregulationgermline variantlysosomal storage diseasemyeloproliferative neoplasm
Figures


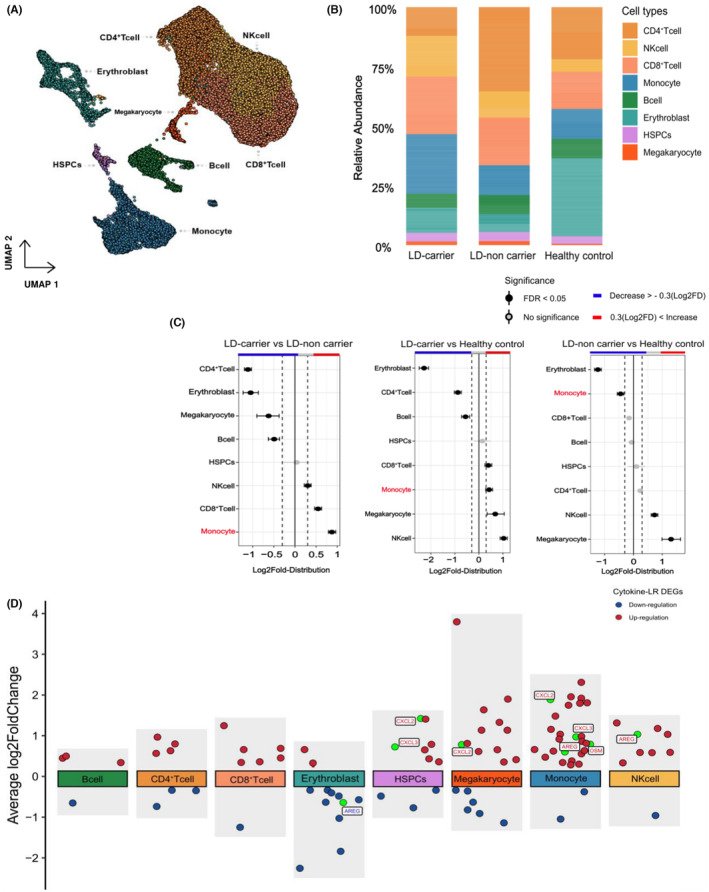
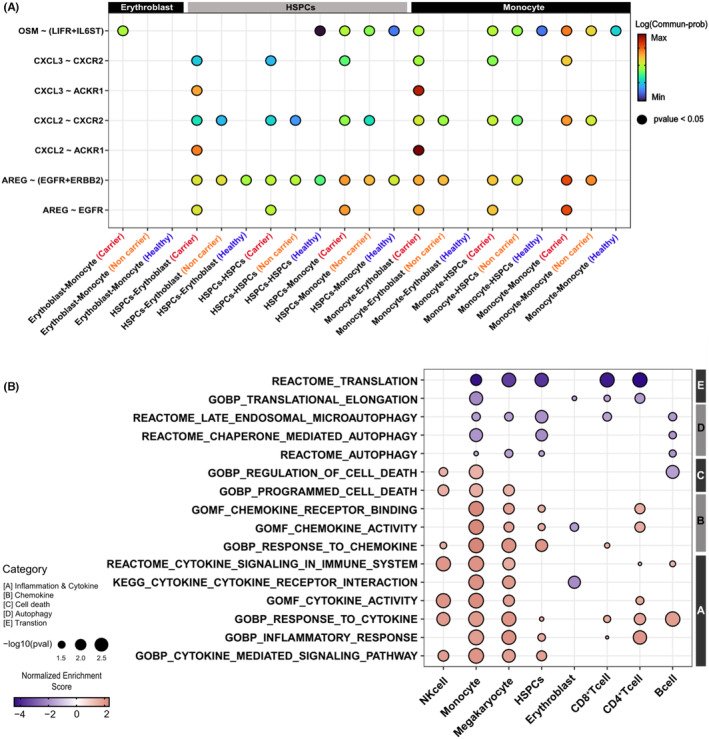
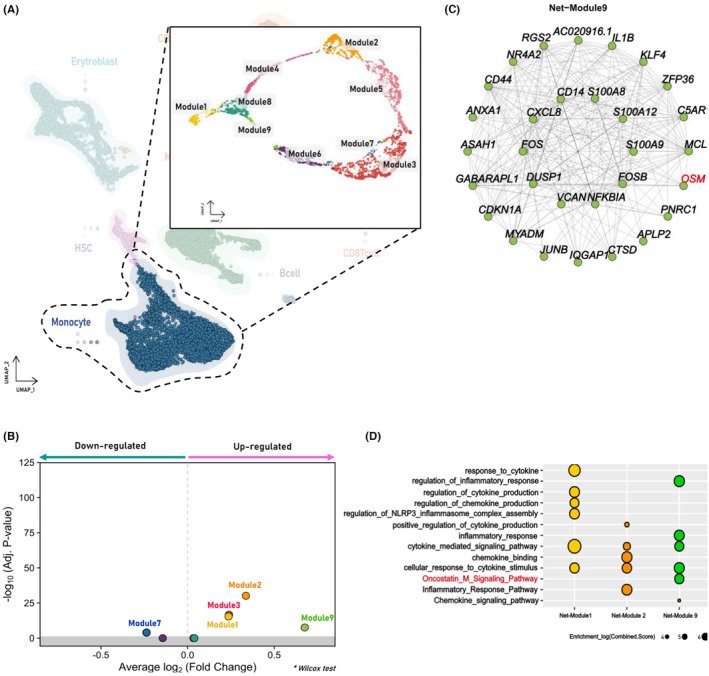

그림 출처: PubMed Central 공개 논문 (PMC11423461)
Conflict of interest statement
TKK has received a research funding from Nextcure TKK is a consultant for Agenus and Immunobiome. These are not relevant to this manuscript. The authors affirm that the research was carried out without any potential conflict of interest arising from commercial or financial relationships.
그 밖의 정보
- 출판 형태
- Journal Article
- 저널
- Cancer medicine · eISSN 2045-7634
- MeSH
- Humans · Myeloproliferative Disorders* / genetics / metabolism · Lysosomes* / metabolism · Male · Female · Middle Aged · Case-Control Studies · Aged · Inflammation / genetics · Cytokines / metabolism / genetics · Polycythemia Vera / genetics / metabolism / pathology · Adult · Gene Expression Profiling · Single-Cell Analysis
- Substances
- Cytokines
- 연구비
- Sanofi GZ201711800
- 참고문헌
- 47편