Department of Internal Medicine, Seoul National University Hospital, Seoul 03080, Korea.
Department of Internal Medicine, Korea University Guro Hospital, Seoul 08308, Korea.
Seoul National University Hospital Biomedical Research Institute, Seoul 03082, Korea.
Department of Internal Medicine, Kangwon National University Hospital, Chuncheon 24295, Korea.
Department of Internal Medicine, Chungbuk National University Hospital, Cheongju 28644, Korea.
ChunLab, Inc., Seoul 06725, Korea.
Kidney Research Institute, Seoul National University, Seoul 08826, Korea.
Department of Internal Medicine, Seoul National University Boramae Medical Center, Seoul 07061, Korea.
Department of Life Science, Multidisciplinary Genome Institute, Hallym University, Chuncheon 24252, Korea.
Abstract
Chronic kidney disease (CKD)-associated uremia aggravates-and is aggravated by-gut dysbiosis. However, the correlation between CKD severity and gut microbiota and/or their uremic metabolites is unclear. We enrolled 103 CKD patients with stage 1 to 5 and 46 healthy controls. We analyzed patients' gut microbiota by MiSeq system and measured the serum concentrations of four uremic metabolites (p-cresyl sulfate, indoxyl sulfate, p-cresyl glucuronide, and trimethylamine N-oxide) by liquid chromatography-tandem mass spectrometry. Serum concentrations of the uremic metabolites increased with kidney function deterioration. Gut microbial diversity did not differ among the examined patient and control groups. In moderate or higher stage CKD groups, Oscillibacter showed positive interactions with other microbiota, and the proportions of Oscillibacter were positively correlated with those of the uremic metabolites. The gut microbiota, particularly Oscillibacter, was predicted to contribute to pyruvate metabolism which increased with CKD progression. Relative abundance of Oscillibacter was significantly associated with both serum uremic metabolite levels and kidney function. Predicted functional analysis suggested that kidney-function-associated changes in the contribution of Oscillibacter to pyruvate metabolism in CKD may greatly affect the gut environment according to kidney function, resulting in dysbiosis concomitant with uremic toxin production. The gut microbiota could be associated with uremia progression in CKD. These results may provide basis for further metagenomics analysis of kidney diseases.
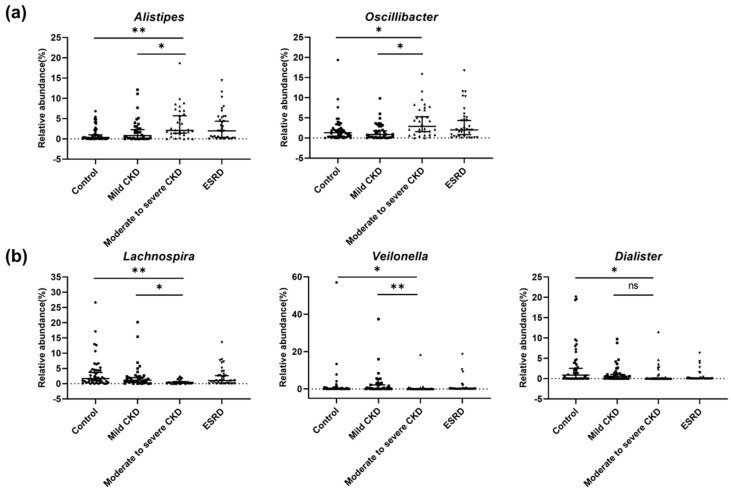
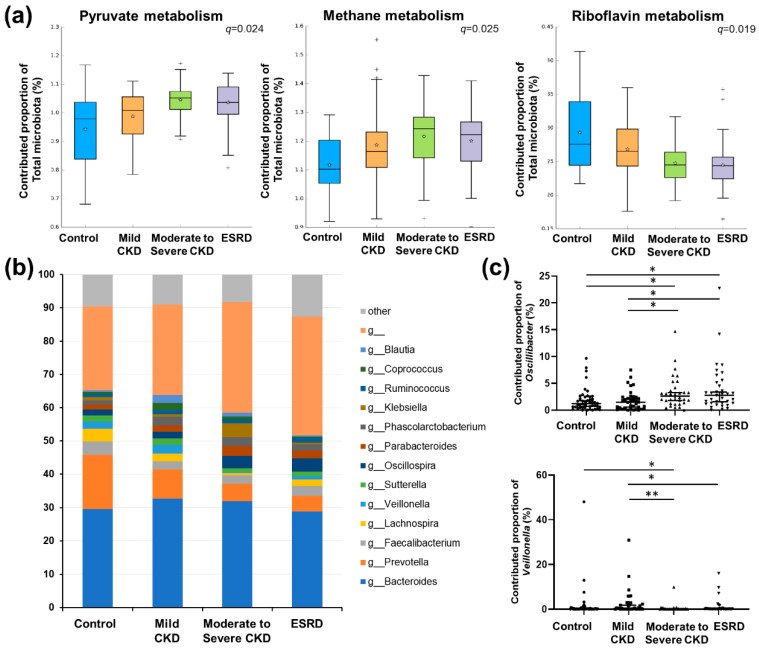
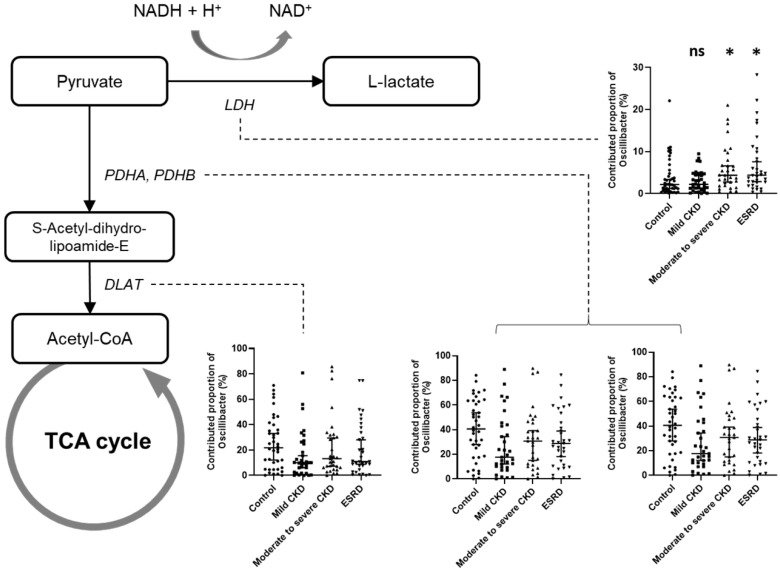
Figure 1Comparison of diversity and taxonomy of gut microbiota according to chronic kidney disease (CKD) severity. (a) Comparison of Shannon diversity indices of gut microbiota among CKD groups. (b) Comparison of number of observed operational taxonomic units (OTUs) of gut microbiota among CKD groups (*, p < 0.05; **, p < 0.01). (c) Principal coordinates analysis (PCoA) based on Bray–Curtis distances of gut microbiota among healthy controls (red), patients with mild CKD (blue), patients with moderate CKD (gray), and patients with end-stage renal disease (ESRD, yellow). The first two axes of the PCoA plot are represented by principal coordinate axis 1 (PCoA1) and principal coordinate axis 2 (PCoA2). (d) Comparison of microbiota composition among CKD groups at the phylum level. red color, Bacteroidetes; blue color, Firmicutes; yellow color, Proteobacteria; gray color, and other phyla with mean relative abundances <1% of total abundance in samples. (e) Comparison of microbiota composition among CKD groups at the genus level. The heatmap plot shows mainly detected genera with mean relative abundances >1% of total abundance in samples; values <1%, unclassified or unidentified, are classified as “others.” The abundances of all genera were plotted after conversion to a binary logarithmic scale.Figure 2Significantly different genera according to renal function in chronic kidney disease (CKD) patients. We determined bacterial genera showing significant differences among patient groups. (a) Genera showing significant increasing trends according to CKD group. (b) Genera showing significant decreasing trends according to CKD group. q-values were determined using the Benjamini–Hochberg method based on the p-values obtained using Mann–Whitney U tests. Single and double asterisks for group comparisons indicate q < 0.05 and q < 0.005, respectively. ns, not significant.Figure 3Co-occurrence network for significantly different genera associated with different chronic kidney disease (CKD) groups. The network shows only significant correlations with q < 0.05. Green lines denote a positive correlation between microbiota, whereas red lines denote a negative correlation. The size of circles indicates the relative abundance of each genus.Figure 4Predicted functional analysis. (a) Comparison of significantly different metabolic pathways among chronic kidney disease (CKD) groups based on predicted functional analysis. Only pathways showing a significant difference among groups were plotted (see Supplementary Table S1 for a complete list of functional pathways). Single and double asterisks for group comparisons indicate q < 0.05 and q < 0.005, respectively. (b) Comparison of the total contribution of genera to the pyruvate metabolism pathway among groups. Only major genera showing a mean proportional contribution >1% among all samples are listed. (c) Comparison of the proportional contributions of Oscillibacter (upper) and Veillonella to the pyruvate metabolism pathway among patient groups. q-values were determined using the Benjamini–Hochberg method based on the p-values obtained using Mann–Whitney U tests. *, q < 0.05; **, q < 0.005.Figure 5Schematic diagram showing the contribution of Oscillibacter to pyruvate metabolism according to renal function. Flow charts were derived based on the Kyoto Encyclopedia of Genes and Genomes (KEGG) pathways. Small bar charts represent a comparison of the contribution of Oscillibacter to different orthologous genes according to the patient group. q-values were determined using the Benjamini–Hochberg method based on the p-values obtained using Mann–Whitney U tests. Asterisks in the bar charts indicate significance (q-value) compared with the control group. ns, not significant; *, q < 0.05.
그림 출처: PubMed Central 공개 논문 (PMC7355700)
Conflict of interest statement
The authors declare no conflicts of interest.
그 밖의 정보
출판 형태
Journal Article
저널
Microorganisms · ISSN 2076-2607
전자 출판
2020-06-16
연구비
Ministry of Science, ICT and Future Planning 2019R1A2C2011465 · Ministry of Science, ICT and Future Planning 2015M3C9A2054342