Department of Internal Medicine, Pusan National University Hospital, Pusan National University School of Medicine, Busan, Korea.
Biomedical Research Institute, Pusan National University Hospital, Busan, Korea.
Natural Product Research Institute, College of Pharmacy, Seoul National University, Seoul, Korea.
Department of Veterinary Biosciences, Faculty of Veterinary Medicine, University of Helsinki, Helsinki, Finland.
Department of Internal Medicine, Ulsan University Hospital, University of Ulsan College of Medicine, Ulsan, Korea.
Department of Internal Medicine, Inje University Busan Paik Hospital, Busan, Korea.
Laboratory Animal Team, Korea Institute of Radiological and Medical Sciences, Seoul, Korea.
Transplantation Center, Seoul National University Hospital, Seoul, Korea.
Department of Internal Medicine, Seoul National University Hospital, Seoul, Korea.
Natural Product Research Institute, College of Pharmacy, Seoul National University, Seoul, Korea. psh@snu.ac.kr.
Department of Internal Medicine, Seoul National University Hospital, Seoul, Korea. khoh@snu.ac.kr.
Department of Internal Medicine, Seoul National University College of Medicine, Seoul, Korea. khoh@snu.ac.kr.
Abstract
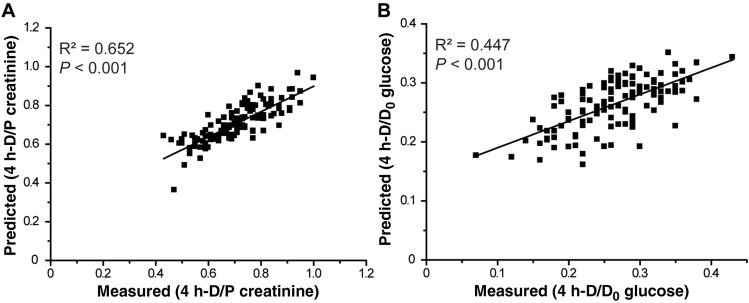
This study primarily aimed to evaluate whether peritoneal equilibration test (PET) results can be predicted through the metabolomic analysis of overnight peritoneal dialysis (PD) effluents. From a total of 125 patients, overnight PD effluents on the day of the first PET after PD initiation were analyzed. A modified 4.25% dextrose PET was performed, and the PET type was categorized according to the dialysate-to-plasma creatinine ratio at the 4-h dwell time during the PET as follows: high, high average, low average, or low transporter. Nuclear magnetic resonance (NMR)-based metabolomics was used to analyze the effluents and identify the metabolites. The predictive performances derived from the orthogonal projection to latent structure discriminant analysis (OPLS-DA) modeling of the NMR spectrum were estimated by calculating the area under the curve (AUC) using receiver operating characteristic curve analysis. The OPLS-DA score plot indicated significant metabolite differences between high and low PET types. The relative concentrations of alanine and creatinine were greater in the high transporter type than in the low transporter type. The relative concentrations of glucose and lactate were greater in the low transporter type than in the high transporter type. The AUC of a composite of four metabolites was 0.975 in distinguish between high and low PET types. Measured PET results correlated well with the total NMR metabolic profile of overnight PD effluents.
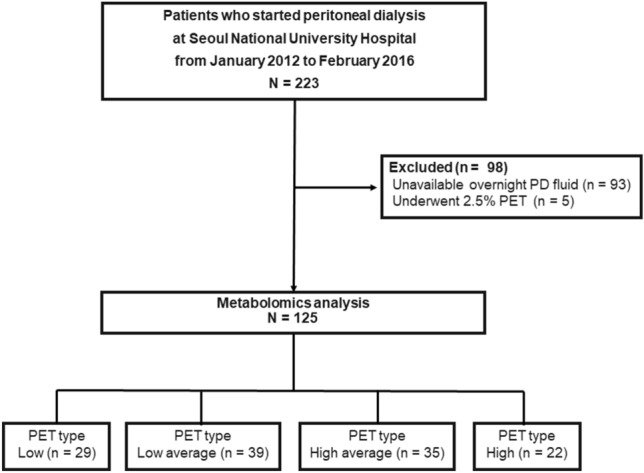
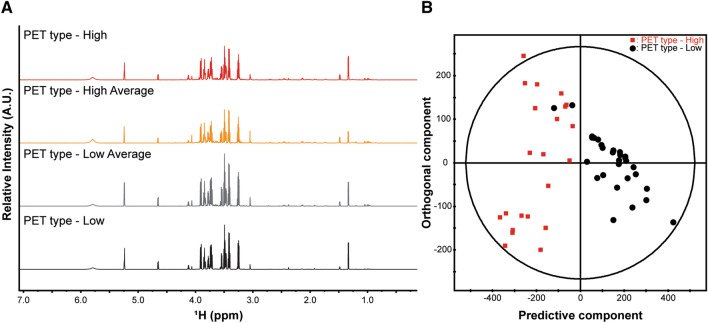
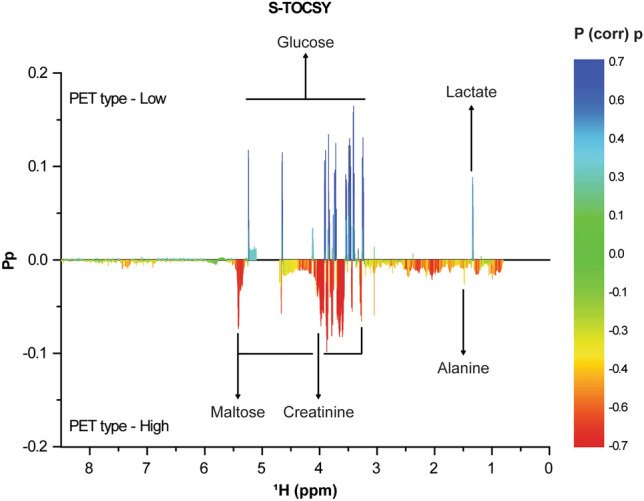
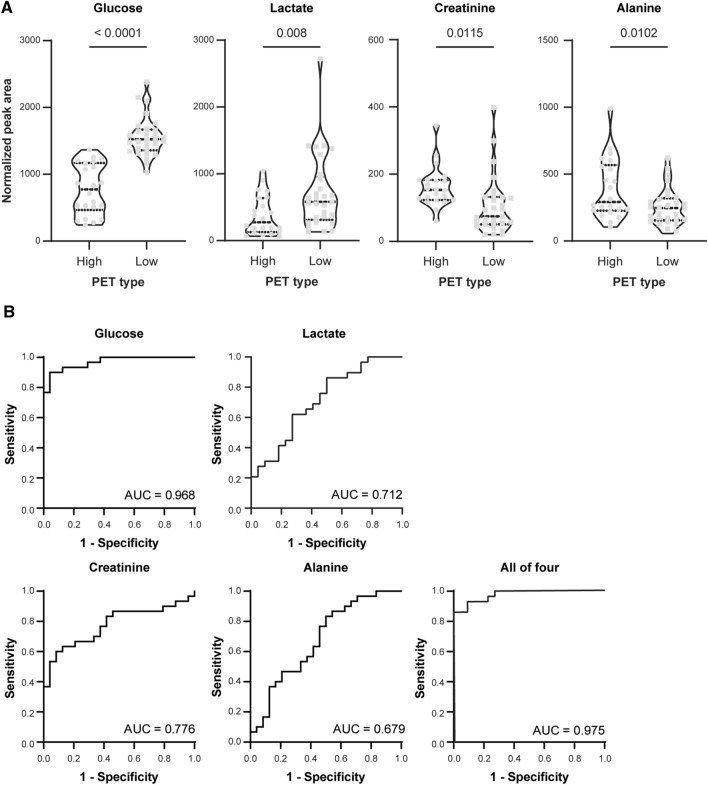
Figure 1Patients in the study analyses. PD peritoneal dialysis, PET peritoneal equilibration test.Figure 2Representative NMR spectra obtained from overnight PD effluents and multivariate analysis between the PET types. (A) In total of 125 PD effluent samples were analyzed using 1D proton NMR spectra and representative samples from each group. A.U. stands for arbitrary unit, which is a relative unit of measurement used to show the intensity ratio in relation to a predetermined reference measurement. (B) OPLS-DA score plot derived from NMR spectra of overnight PD effluents between high and low PET types. OPLS-DA score plot showing the predictive component (X-axis) and the orthogonal component (Y-axis) of the model. The discrimination model was obtained with 1 predictive and 2 orthogonal components with the goodness of fit (R2) of 0.737 and the predictability (Q2) of 0.666. Each symbol represents the metabolic characteristic of a particular sample in the projected dimensions of predictive and 2 orthogonal components. The separation along the predictive component axis indicates the difference of interest (high versus low PET type) from the metabolic profile. OPLS-DA orthogonal projections to latent structure discriminant analysis, NMR nuclear magnetic resonance, PET peritoneal equilibration test.Figure 3Identification of metabolites contributing to the discriminating model. S-TOCSY from the OPLS loading plot indicates the model coefficients for NMR variables. Signals are color-coded by the weights as a discriminator between the high and low PET types. Pp stands for modeled covariation, and P (corr) p stands for modeled correlation, as indicated by the color scale on the right. P (corr) p values for each of these signals indicate that multiple metabolite signals, rather than a single overwhelmingly prominent marker, contribute to differentiation. The metabolites that significantly distinguish the high and low PET types are annotated in the model coefficient plot. S-TOCSY statistical total correlation spectroscopy, OPLS orthogonal projections to latent structure, NMR nuclear magnetic resonance, PET peritoneal equilibration test.Figure 4Statistical significance of the markers. (A) Levels of markers between the high and low PET types. Violin plots are presented with the median and quartiles. The levels were determined by the mean peak areas normalized by the total area from 1D proton NMR spectra in Fig. 2A. (B) PLS-DA-based ROC curves for the diagnosis of high and low PET types with the individual markers–glucose, lactate, creatinine, and alanine and the combination of the 4 markers. Statistical analysis of markers was performed using the Benjamini–Hochberg correction, and the resulting FDRP-values are indicated. PET peritoneal equilibration test, NMR nuclear magnetic resonance, PLS-DA partial least square-discriminant analysis, ROC receiver operating characteristic, AUC area under the curve, FDR false discovery rate.Figure 5Prediction of measured PET results from total NMR signals. Prediction model between total NMR signals and measured PET results: (A) 4 h-D/P creatinine and (B) 4 h-D/D0 glucose. The Y-axis corresponds to the predicted values that were calculated using the PLS regression followed by total NMR signal prediction. The X-axis corresponds to the measured 4 h-D/P creatinine (A) and 4 h-D/D0 glucose (B) for determining the PET. The black line represents the best fit between the predicted and observed PET results. PET peritoneal equilibration test, PLS partial least square, NMR nuclear magnetic resonance.