
Oncotarget. 2017;8(30):49796-49806.
DAXX/ATRX and MEN1 genes are strong prognostic markers in pancreatic neuroendocrine tumors.
제1저자 박주경, 백우현 · 교신저자 류지곤
소속 (3)
- Division of Gastroenterology, Department of Medicine, Samsung Medical Center, Sungkyunkwan University School of Medicine, Seoul, Korea.
- Department of Internal Medicine and Liver Research Institutute, Seoul National University Hospital, Seoul National University College of Medicine, Seoul, Korea.
- Department of Pathology, Seoul National University Hospital, Seoul National University College of Medicine, Seoul, Korea.
Abstract
BACKGROUND PanNETs shows heterogeneous biological behaviors. The aim was to investigate prognostic markers based on most frequently mutated genes in PanNETs.
RESULTS There was a total of 76 patients (M: 39, F: 37) with pathologically proven PanNETs. ATRX/DAXX and MEN1 protein expression was detected in 16 (21%) and 31 (41%) patients, respectively. The mean OS of the total study patients was 16 years, and DFS was 17 years among the 68 patients with curative resections. PanNETs presented with distant metastasis or loss of ATRX/DAXX protein expression was the independent prognostic factors associated with poor OS. In curative resected PanNETs, there was no significant difference in the mean DFS according to ATRX/DAXX or MEN1 protein. However, there was statistically significant difference in survival after the recurrence according to the expression of ATRX/DAXX protein; Y/N: 10 vs. 15 years, p < 0.001. In metastatic PanNETs, we could find out OS was significantly longer in negative protein expression of ATRX/DAXX and MEN1 groups; 7 vs. 1 years, p < 0.001, 6 vs. 2 years, p = 0.02, respectively.
MATERIALS AND METHODS The histologically proven PanNETs were enrolled and the clinicopathologic and genetic alterations were evaluated.
CONCLUSIONS Protein expression of MEN1 and DAXX/ATRX can be prognostic markers for PanNETs. Further investigation in genetic alterations of PanNETs may give us insights understanding the behavior of PanNETs.
Keywords
DAXX/ATRXMENneuroendocrine tumor
Figures

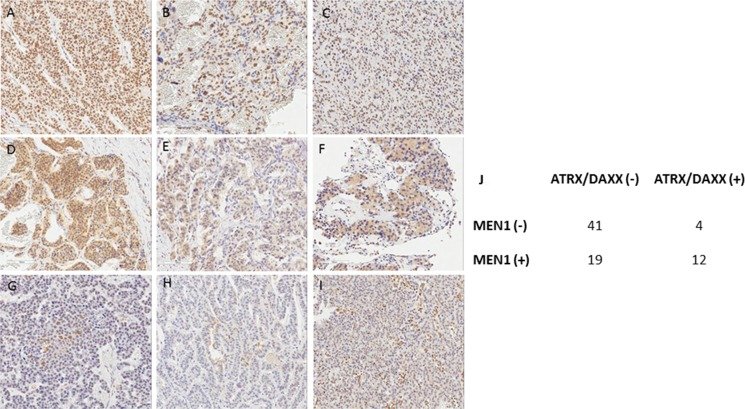


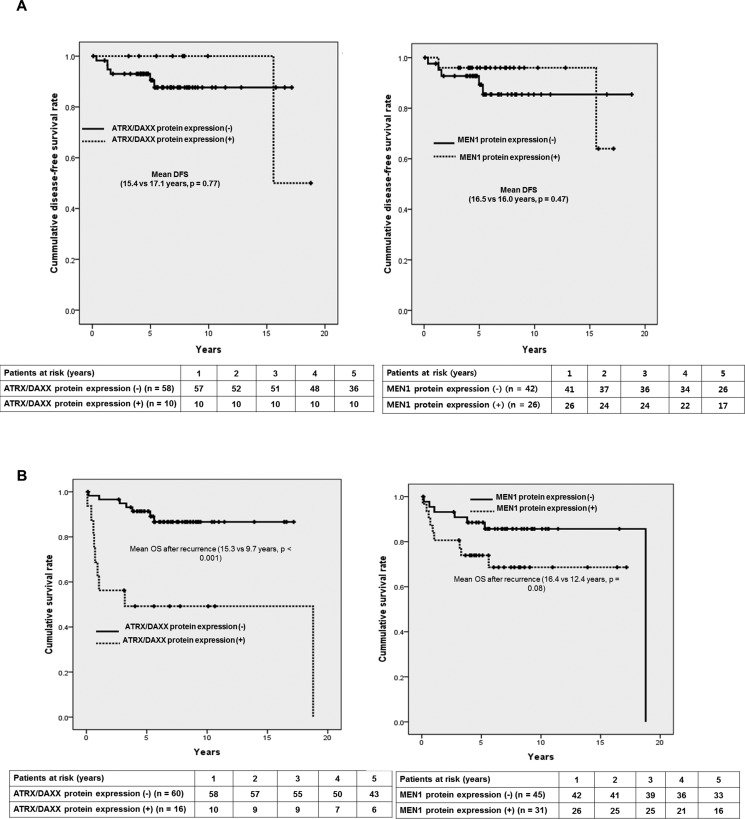
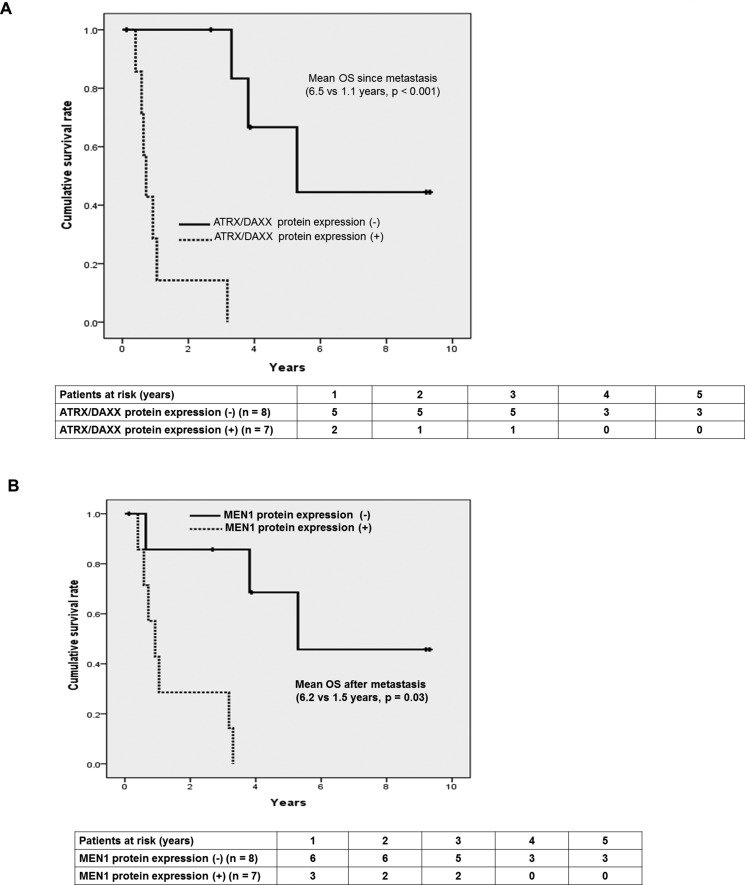
그림 출처: PubMed Central 공개 논문 (PMC5564808)
Conflict of interest statement
CONFLICTS OF INTEREST. None.
그 밖의 정보
- 출판 형태
- Journal Article
- 저널
- Oncotarget · eISSN 1949-2553
- MeSH
- Adaptor Proteins, Signal Transducing / genetics / metabolism · Adult · Aged · Biomarkers, Tumor · Co-Repressor Proteins · Female · Gene Expression · Humans · Immunohistochemistry · Kaplan-Meier Estimate · Male · Middle Aged · Molecular Chaperones · Neoplasm Grading · Neoplasm Metastasis · Neoplasm Staging · Neuroendocrine Tumors / diagnosis / metabolism / mortality / therapy · Nuclear Proteins / genetics / metabolism · Pancreatic Neoplasms / diagnosis / metabolism / mortality / therapy · Prognosis · Proto-Oncogene Proteins / genetics / metabolism · X-linked Nuclear Protein / genetics / metabolism · Young Adult
- Substances
- Adaptor Proteins, Signal Transducing · Biomarkers, Tumor · Co-Repressor Proteins · DAXX protein, human · MEN1 protein, human · Molecular Chaperones · Nuclear Proteins · Proto-Oncogene Proteins · ATRX protein, human · X-linked Nuclear Protein
- 참고문헌
- 29편