
PLoS Genet. 2016;12(8):e1006239.
Comprehensive Analysis of the Transcriptional and Mutational Landscape of Follicular and Papillary Thyroid Cancers.
제1저자 유승근, 이승복, 김수진 · 교신저자 박영주, 이규언, 서정선
소속 (10)
- Genomic Medicine Institute, Medical Research Center, Seoul National University, Seoul, Republic of Korea.
- Interdisciplinary Program in Bioinformatics, Seoul National University, Seoul, Republic of Korea.
- Department of Surgery, Seoul National University College of Medicine, Seoul, Republic of Korea.
- Cancer Research Institute, Seoul National University College of Medicine, Seoul, Republic of Korea.
- Research Institute, National Medical Center, Seoul, Republic of Korea.
- Department of Biomedical Sciences, Seoul National University Graduate School, Seoul, Republic of Korea.
- Department of Internal Medicine, Seoul National University College of Medicine, Seoul, Republic of Korea.
- Department of Pathology, Seoul National University College of Medicine, Seoul, Republic of Korea.
- Macrogen Inc., Seoul, Republic of Korea.
- Department of Biochemistry and Molecular Biology, Seoul National University College of Medicine, Seoul, Republic of Korea.
Abstract
Follicular thyroid carcinoma (FTC) and benign follicular adenoma (FA) are indistinguishable by preoperative diagnosis due to their similar histological features. Here we report the first RNA sequencing study of these tumors, with data for 30 minimally invasive FTCs (miFTCs) and 25 FAs. We also compared 77 classical papillary thyroid carcinomas (cPTCs) and 48 follicular variant of PTCs (FVPTCs) to observe the differences in their molecular properties. Mutations in H/K/NRAS, DICER1, EIF1AX, IDH1, PTEN, SOS1, and SPOP were identified in miFTC or FA. We identified a low frequency of fusion genes in miFTC (only one, PAX8-PPARG), but a high frequency of that in PTC (17.60%). The frequencies of BRAFV600E and H/K/NRAS mutations were substantially different in miFTC and cPTC, and those of FVPTC were intermediate between miFTC and cPTC. Gene expression analysis demonstrated three molecular subtypes regardless of their histological features, including Non-BRAF-Non-RAS (NBNR), as well as BRAF-like and RAS-like. The novel molecular subtype, NBNR, was associated with DICER1, EIF1AX, IDH1, PTEN, SOS1, SPOP, and PAX8-PPARG. The transcriptome of miFTC or encapsulated FVPTC was indistinguishable from that of FA, providing a molecular explanation for the similarly indolent behavior of these tumors. We identified upregulation of genes that are related to mitochondrial biogenesis including ESRRA and PPARGC1A in oncocytic follicular thyroid neoplasm. Arm-level copy number variations were correlated to histological and molecular characteristics. These results expanded the current molecular understanding of thyroid cancer and may lead to new diagnostic and therapeutic approaches to the disease.
Figures

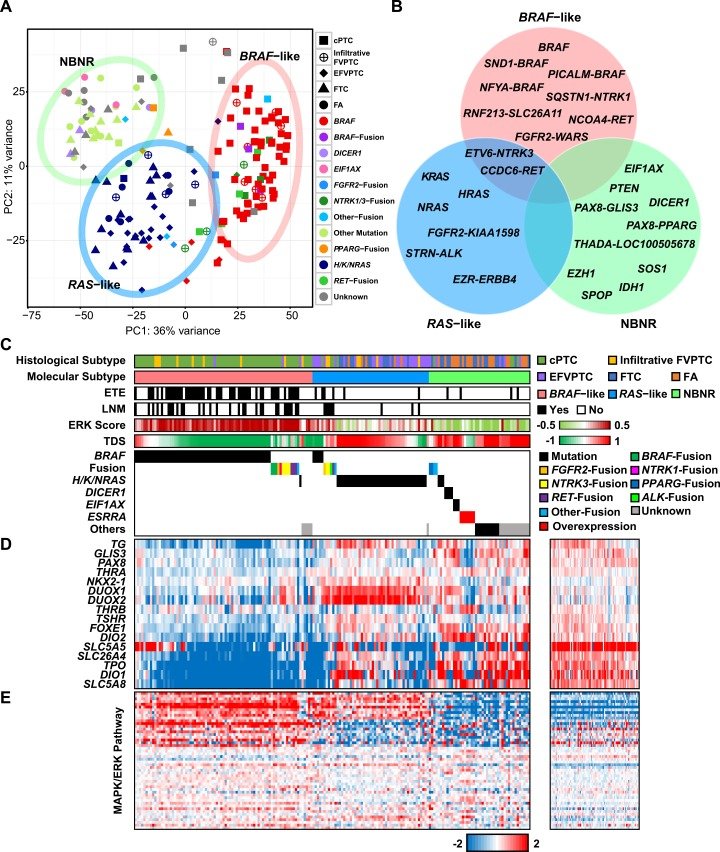


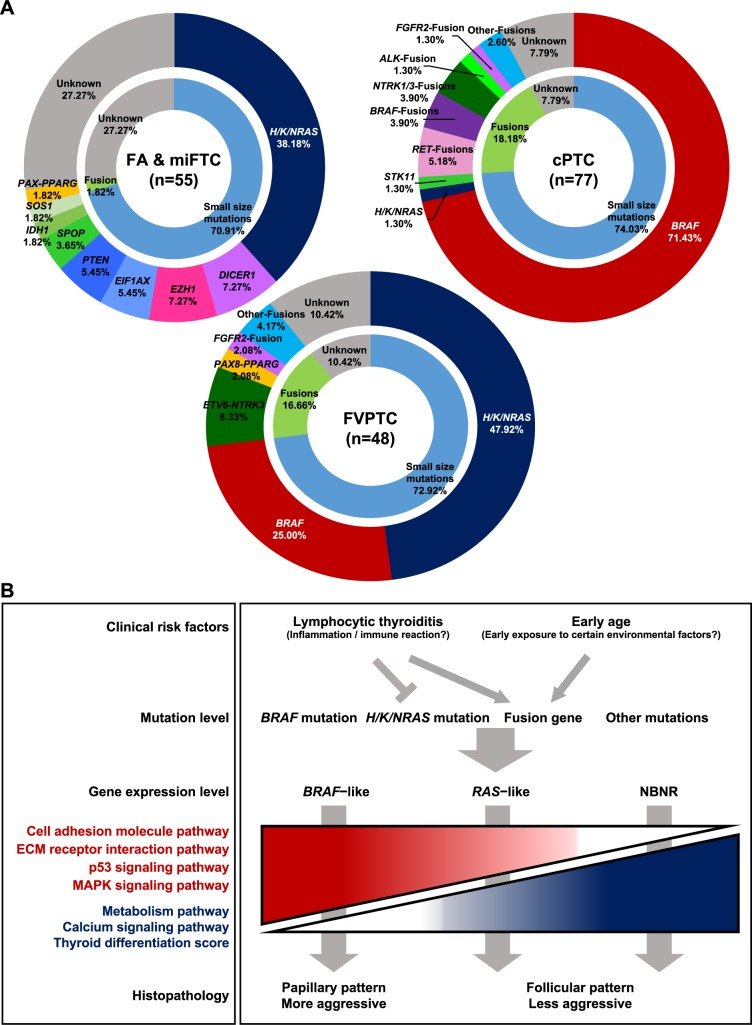
그림 출처: PubMed Central 공개 논문 (PMC4975456)
Conflict of interest statement
JSS and JYS are affiliated with Macrogen Inc. The affiliations to this company, along with any other relevant declarations relating to employment, consultancy, patents, products in development or marketed products etc, do not alter the authors' adherence to PLOS GENETICS policies on sharing data and materials.
그 밖의 정보
- 출판 형태
- Journal Article
- 저널
- PLoS genetics · eISSN 1553-7404
- 전자 출판
- 2016-08-05
- MeSH
- Adenoma / diagnosis / genetics / pathology · Adult · Aged · Carcinoma / diagnosis / genetics · Carcinoma, Papillary · Female · Gene Expression Regulation, Neoplastic / genetics · High-Throughput Nucleotide Sequencing · Humans · Male · Middle Aged · Mutation · Neoplasm Proteins / biosynthesis / genetics · Thyroid Cancer, Papillary · Thyroid Neoplasms / diagnosis / genetics · Transcriptome / genetics
- Substances
- Neoplasm Proteins
- 참고문헌
- 68편