
J Clin Med. 2019;8(3):jcm8030366.
Fimasartan for Remodeling after Myocardial Infarction.
제1저자 임병관 박진주 · 교신저자 최동주
소속 (7)
- Department of Biomedical Science, Jungwon University, Goesan-gun 28024, Korea. bkwan.lim@gmail.com.
- Department of Internal Medicine, College of Medicine, Seoul National University Bundang Hospital, Seongnam 13620, Korea. jinjooparkmd@gmail.com.
- Division of Cardiology, Department of Internal Medicine, Cardiovascular Imaging Center, Heart Vascular Stroke Institute, Samsung Medical Center, Sungkyunkwan University School of Medicine, Seoul 06351, Korea. tyche.park@gmail.com.
- Division of Cardiology, Department of Internal Medicine, Cardiovascular Imaging Center, Heart Vascular Stroke Institute, Samsung Medical Center, Sungkyunkwan University School of Medicine, Seoul 06351, Korea. eelulee@daum.net.
- Division of Cardiovascular and Rare Disease, Korea National Institute of Health, Osong, Cheongju, Chungbuk 28159, Korea. gonkjs@hanmail.net.
- Department of Internal Medicine, College of Medicine, Seoul National University Bundang Hospital, Seongnam 13620, Korea. until10@hanmail.net.
- Department of Internal Medicine, College of Medicine, Seoul National University Bundang Hospital, Seongnam 13620, Korea. djchoi@snubh.org.
Abstract
An angiotensin receptor blocker (ARB) mitigates cardiac remodeling after myocardial infarction (MI). Here, we investigated the effect of fimasartan, a new ARB, on cardiac remodeling after MI. Sprague⁻Dawley rats were assigned into 3 groups: surgery only (sham group, n = 7), MI without (MI-only group, n = 13), and MI with fimasartan treatment (MI + Fima group, n = 16). MI was induced by the permanent ligation of the left anterior descending artery. Treatment with fimasartan (10 mg/kg) was initiated 24 h after MI and continued for 7 weeks. Rats in the MI + Fima group had a higher mean ejection fraction (66.3 ± 12.5% vs. 51.3 ± 14.8%, P = 0.002) and lower left ventricular end-diastolic diameter (9.14 ± 1.11 mm vs. 9.91 ± 1.43 mm, P = 0.045) than those in the MI-only group at 7 weeks after MI. The infarct size was lower in the MI + Fima than in the MI group (P < 0.05). A microarray analysis revealed that the expression of genes related to the lipid metabolism and mitochondrial membrane ion transporters were upregulated, and those involved in fibrosis and inflammation were downregulated by fimasartan. Fimasartan attenuates cardiac remodeling and dysfunction in rats after MI and may prevent the progression to heart failure after MI.
Keywords
angiotensin receptor blockercardiac remodelingfimasartanmicroarraymyocardial infarction
Figures

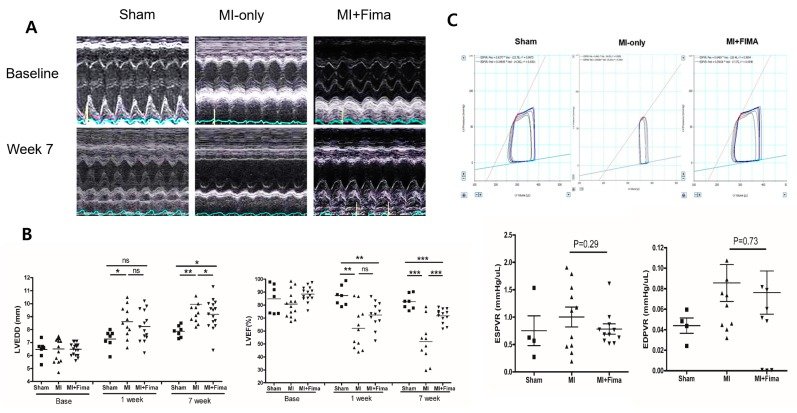
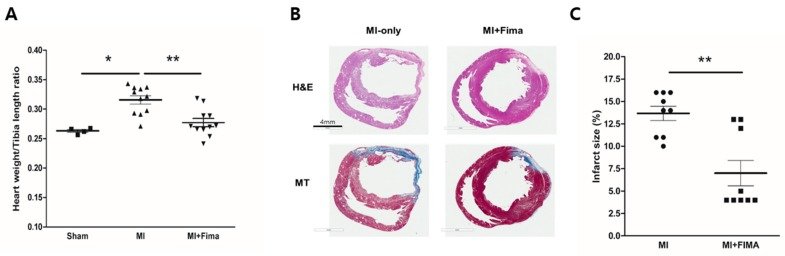
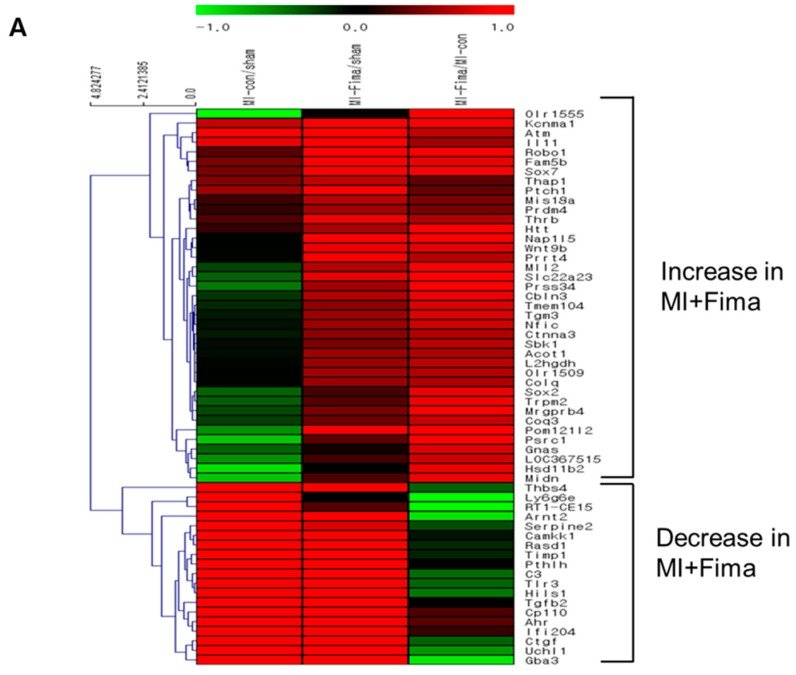
그림 출처: PubMed Central 공개 논문 (PMC6463200)
Conflict of interest statement
The authors declare no conflict of interest.
그 밖의 정보
- 출판 형태
- Journal Article
- 저널
- Journal of clinical medicine · ISSN 2077-0383
- 전자 출판
- 2019-03-15
- 참고문헌
- 29편