Departments of Internal Medicine, Seoul National University Bundang Hospital, Seongnam, Korea.
Department of Internal Medicine, Kyungpook National University Hospital, Daegu, Korea.
Department of Internal Medicine and Liver Research Institute, Seoul National University College of Medicine, Seoul, Korea.
Departments of Pathology, Seoul National University Bundang Hospital, Seongnam, Korea.
Department of Gastroenterology and Digestive Disease Research Institute, Wonkwang University School of Medicine, Iksan, Korea.
Abstract
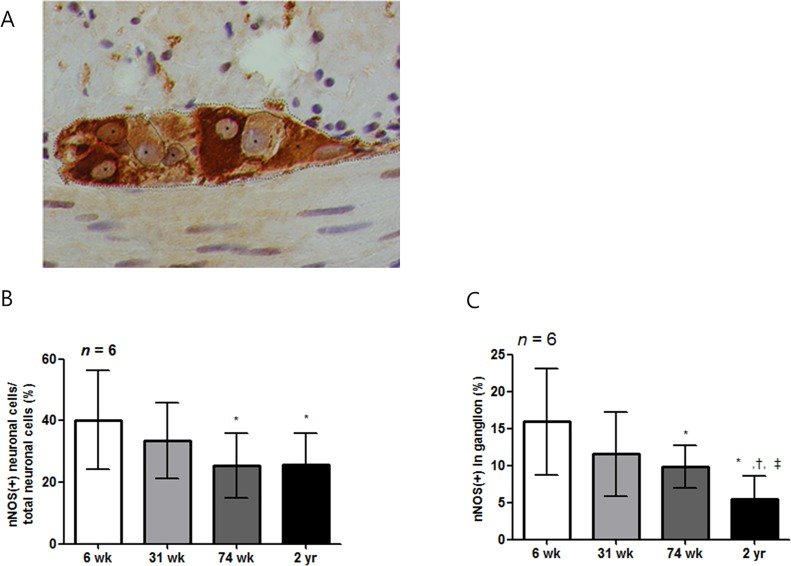
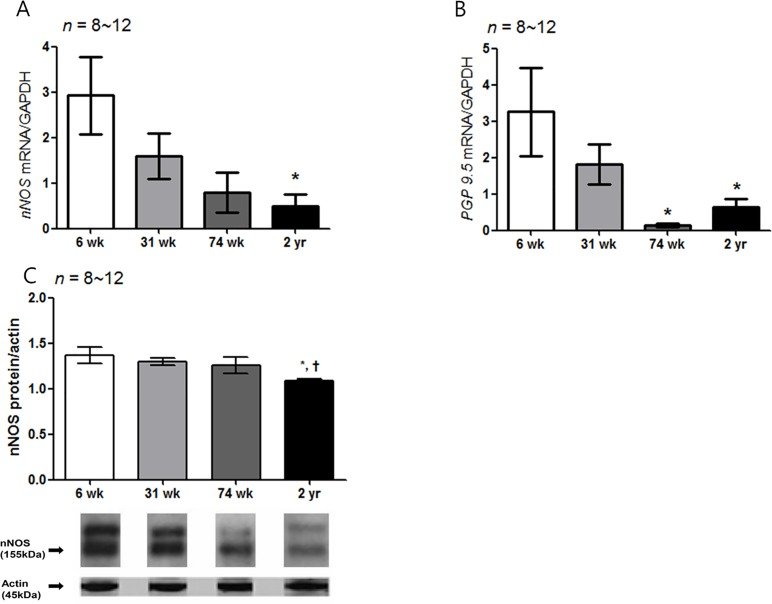
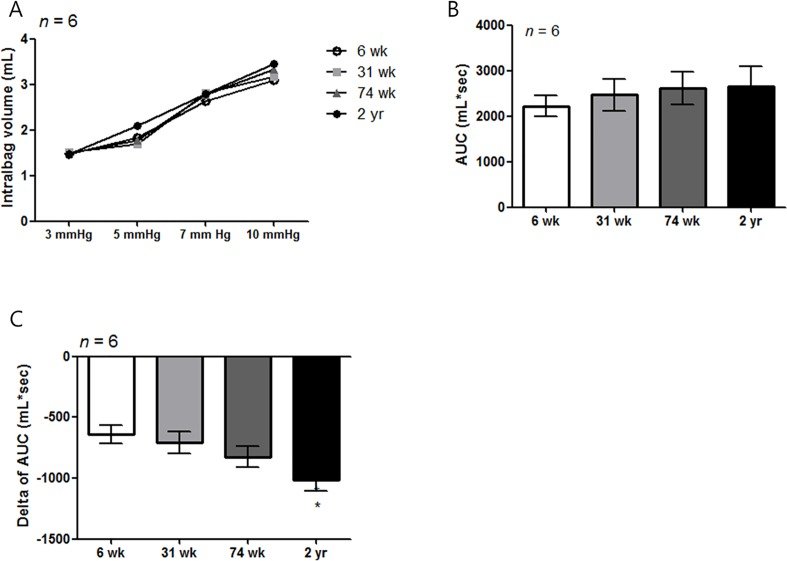
The gastric accommodation reflex is an important mechanism in gastric physiology. However, the aging-associated structural and functional changes in gastric relaxation have not yet been established. Thus, we evaluated the molecular changes of interstitial cell of Cajal (ICC) and neuronal nitric oxide synthase (nNOS) and the function changes in the corpus of F344 rats at different ages (6-, 31-, 74-wk and 2-yr). The proportion of the c-Kit-positive area in the submucosal border (SMB) and myenteric plexus (MP) layer was significantly lower in the older rats, as indicated by immunohistochemistry. The density of the nNOS-positive immunoreactive area also decreased with age in the SMB, circular muscle (CM), and MP. Similarly, the percent of nNOS-positive neuronal cells per total neuronal cells and the proportion of nNOS immunoreactive area of MP also decreased in aged rats. In addition, the mRNA and protein expression of c-Kit and nNOS significantly decreased with age. Expression of stem cell factor (SCF) and the pan-neuronal marker PGP 9.5 mRNA was significantly lower in the older rats than in the younger rats. Barostat studies showed no difference depending on age. Instead, the change of volume was significantly decreased by L-NG63-nitroarginine methyl ester in the 2-yr-old rats compared with the 6-wk-old rats (P = 0.003). Taken together, the quantitative and molecular nNOS changes in the stomach might play a role in the decrease of gastric accommodation with age.
Figures
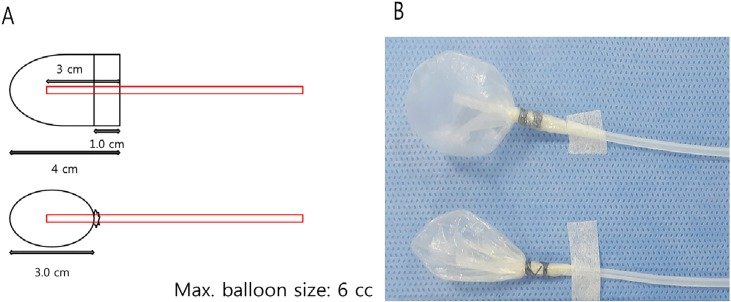
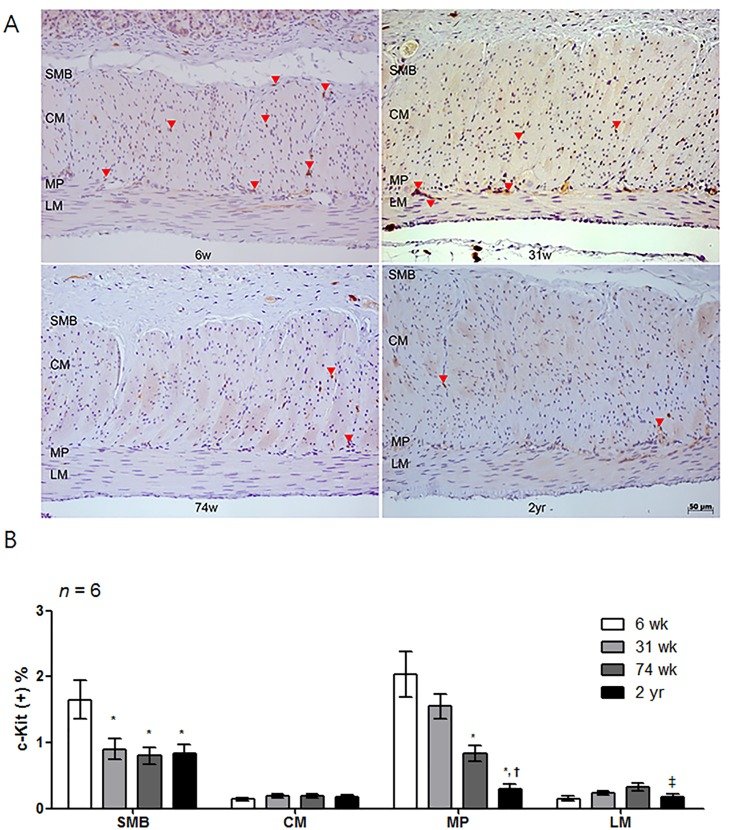
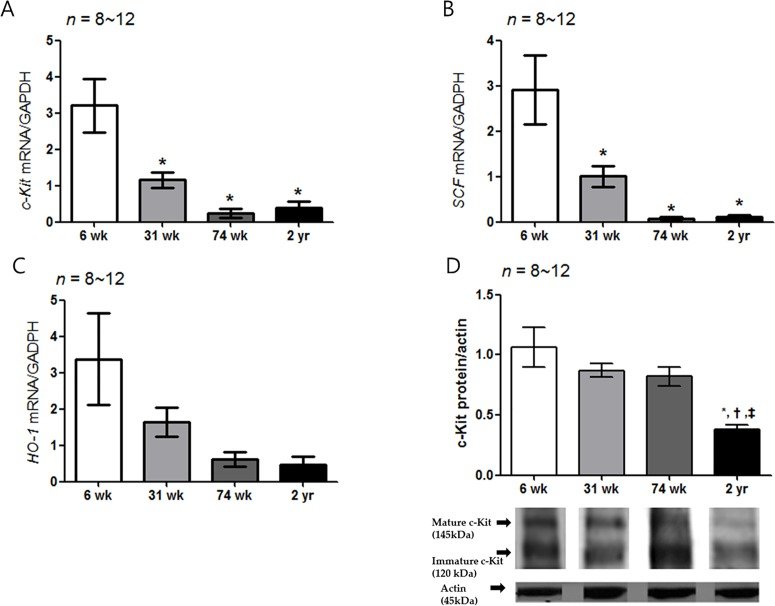
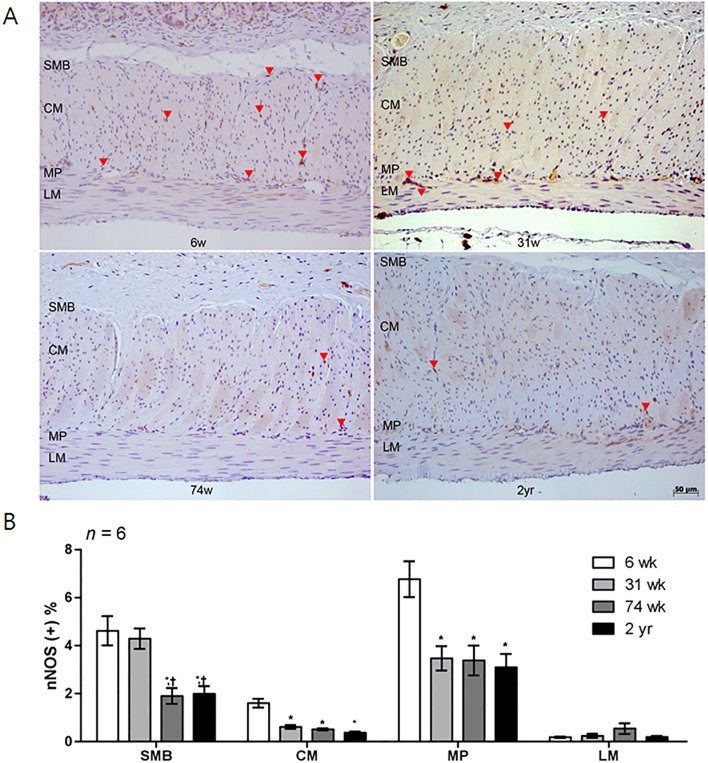
Fig 1 Diagram of rat stomach. The stomach of the rat is divided into the forestomach (pars proventricularis) and glandular stomach (pars glandularis). For this experiment, the proximal glandular stomach of F344 rat was used after removing forestomach. Stomach was opened along the greater curvature and about a one-centimeter length of proximal glandular stomach (corpus) was used for immunohistochemistry (rectangular box in the right side).Fig 2 The intra-gastric balloon. (A) A polyethylene bag was made by using a 3rd finger-tip of poly-glove (Hanjin, Seoul, Korea). Maximal diameter is 3 cm. (B) The maximum volume of balloon was 6 mL and air was injected into the balloon from one of the balloon tubes with the other side balloon tube closed to allow placement of the balloon within the stomach, after which the balloon tubes were immediately opened to the air.Fig 3 Measurement of the change in gastric accommodation. (A) The pressure-dependent volume curve obtained by applying 3, 5, 7, and 10 mmHg at 5 minute intervals was measured in each aged rat group. The change of volume and area under curve (AUC) of the pressure-dependent volume was measured in each group to obtain the pressure-related volume (mL) * time (sec) in the tonic phase. (B) To analyze the gastric accommodation in each aged rat group, we compared with the pressure associated volume change and baseline AUC (mL*sec) of the aged rat groups. Afterwards, we compared the change in AUC (Δ AUC: AUC 2—AUC 1) after administering L-NAME to analyze the response of nNOS activity with age indirectly. The blue and red lines in the graph represent the pressure and volume curves of the 6-wk- and 2-yr-old rats. L-NAME, L-NG-nitroarginine methylester.Fig 4 Analysis of c-Kit immunohistochemistry. (A) Photomicrograph of c-Kit immunostaining of the proximal rat stomach. Arrows indicate the c-Kit immunoreactive cells (x200 magnification). (B) Comparison of the proportion of the c-Kit immunoreactive area of the SMB, MP, CM and LM in 6-, 31-, 74-wk- and 2-yr-old rats (n = 6 per group). The proportion of the c-Kit immunoreactive area tended to decrease with age. The result was expressed as the c-Kit positive percentage of the total area of each region. Each bar represents the mean ± SE. SMB, submucosal border; MP, myenteric plexus; CM, circular muscle; LM, longitudinal muscle.*P < 0.05 compared with 6-wk-old rats; †P < 0.05 compared with 31-wk-old rats; ‡P < 0.05 compared with 74-wk-old rats.Fig 5 Expression of c-Kit, SCF, HO-1 mRNA and c-Kit protein. (A) The expression of c-Kit mRNA by real-time PCR decreased with age. The c-Kit mRNA expression decreased significantly in the 31-, 74-wk-old and 2-yr-old rats compared with the 6-wk-old rats (P = 0.002 vs. 31-wk-old rats and P < 0.001 vs. 74-wk- and 2-yr-old rats): 6-wk-old rat group (n = 10), 31-wk-old rat group (n = 10), 74-wk-old rat group (n = 8) and 2-yr-old rat group (n = 12). (B) The SCF mRNA expression of other aged rat group was significantly lower than that of the 6-wk-old rat (P = 0.004 vs. 31-wk-old rats; P < 0.001 vs. 74-wk- and 2-yr-old rats) (n = 8–12). (C) No statistical difference was showed the HO-1 mRNA expression in different age rat group. (D) The c-Kit protein expression decreased with age. The c-Kit protein expression of 2-yr-old rats was lower than that of the other aged rat groups (P < 0.001 vs. 31-wk-old rats; P = 0.001 vs. 74-wk-old rats and P = 0.009 vs. 2-yr-old rats) (n = 8–12). The results are shown as the mean value of the optical density (OD). The optical densities corresponding to the mature (145 kDa) and immature (120 kDa) forms were combined in the analysis process using densitometry. Each bar represents the mean ± SE. *P < 0.05 compared with 6-wk-old rats. †P < 0.05 compared with 31-wk-old rats; ‡P < 0.05 compared with 74-wk-old rats.Fig 6 Analysis of nNOS immunohistochemistry. (A) Photomicrograph of nNOS immunostaining of the corpus of rat stomach. Arrows and arrowheads indicate the nNOS-positive nerve fibers and neuronal ganglion, respectively (x200 magnification). (B) Comparison of the nNOS positive area (n = 6 per group). The proportion of the nNOS immunoreactive area decreased with age. Each bar represents the mean ± SE. SMB, submucosal border; MP, myenteric plexus; CM, circular muscle; LM, longitudinal muscle.*P < 0.05 compared with 6-wk-old rats; †P < 0.05 compared with 31-wk-old rats; ‡P < 0.05 compared with 74-wk-old rats.Fig 7 The enumeration of neuronal cell in myenteric ganglia. (A) ganglia in the myenteric plexus were micro graphed at x1,000. We enumerated the nNOS-positive (indicated with red line) or -negative (indicated with black line) myenteric neurons, which include nucleus (indicated with asterisk), in the ganglion (contours of the ganglion are indicated by dashed lines). (B) The percent of nNOS positive neuronal cells of total neuronal cells in ganglion of 74-wk-old and 2-yr-old rats was significantly lower than that of 6- and 31-wk-old rats (P = 0.002, 6-wk- vs. 74-wk-old rats; P = 0.002, 6-wk- vs. 2-yr-old rats; P = 0.041, 31-wk- vs. 74-wk-old rats, and P = 0.019, 31-wk- vs 2-yr-old rats). (C) Mean of proportion of nNOS-immunoreactive area in ganglion was also decreased as age increased (P = 0.020, 6-wk- vs. 31-wk-old rats; P = 0.001, 6-wk- vs. 74-wk-old rats; P < 0.001, 6-wk- vs. 2-yr-old rats; P < 0.001, 31-wk- vs. 2-yr-old rats, and P < 0.001, 74-wk- vs 2-yr-old rats). Each bar represents the mean±SE. *P < 0.05 compared with 6 wk of age; †P < 0.05 compared with 31-wk of age; ‡ P < 0.05 compared with 74-wk-old rats.Fig 8 Expression of nNOS and PGP 9.5 mRNA and nNOS protein. (A) The expression of nNOS mRNA measured by real-time PCR decreased with age. The nNOS mRNA expression decreased in the 2-yr-old rats compared with the 6- wk-old rats (P = 0.021): 6-wk-old rat group (n = 10), 31-wk-old rat group (n = 10), 74-wk-old rat group (n = 8) and 2-yr-old rat group (n = 12). (B) The PGP 9.5 mRNA expression of the 74-wk-old and 2-yr-old rats was also lower than that of the 6-wk-old rats (P = 0.007, 6-wk- vs. 74-wk-old rats and P = 0.030, 6-wk- vs. 2-yr-old rats), respectively. (C) The nNOS protein expression was the lowest in 2-yr-old rats. That is, the nNOS protein expression of the 2-yr-old rats was significantly lower than that of the 6-wk-old rats (P = 0.007) (n = 8–12 in 6-, 31-, 74-wk- and 2-yr-old rats). The results are shown as the mean value of the optical density (OD). Each bar represents the mean ± SE. *P < 0.05 compared with 6-wk-old rats; †P < 0.05 compared with 31-wk-old rats; ‡P < 0.05 compared with 74-wk-old rats.Fig 9 Measurement of gastric volume change and influences of L-NAME in different aged rat group. (A) The graph of pressure dependent volume curve did not show statistical difference in each given pressure (n = 6 per group). (B) Pressure dependent AUC (mL*sec) curve did not show any difference as aging (n = 6 per group). After treatment with L-NAME (10 mg/kg), the delta of the AUC significantly decreased in the 2-yr-old rats compared with the 6-wk-old age rats (P < 0.05). *P < 0.05 compared with 6-wk-old rats.