Department of Internal Medicine, Seoul National University Bundang Hospital, Seongnam-si, Gyeonggi-do, 13620, Republic of Korea.
Department of Internal Medicine, Seoul National University College of Medicine, Seoul, 03080, Republic of Korea.
Abstract
Pancreatic cancer (PC) is an intractable cancer that is difficult to diagnose early and has a 5-year survival rate of less than 8%. ZW10-interacting kinetochore protein (ZWINT) is a crucial gene that contributes to chromosome instability and is essential for spindle assembly and kinetochore-microtubule attachment during meiosis and mitosis. However, the mechanism through which Zwint-1 promotes PC progression is yet to be elucidated. Here, we report that Zwint-1 is highly expressed in clinical PC specimens (based on analysis of the Gene Expression Profiling Interactive Analysis database) and various PC cell lines. Importantly, Zwint-1-deficient PC cells showed reduced nuclear factor-kappa B (NF-κB) (Ser536) phosphorylation along with inhibited proliferation and colony formation due to downregulation of NF-κB-regulated genes such as CCND1, cIAP1/2, and XIAP. In addition, Zwint-1-deficient PC cells showed reduced invasion and migration abilities, and decreased expression levels of the metalloproteinases MMP2 and MMP9. Furthermore, Zwint-1 deficiency arrested the PC cell cycle at the G2/M phase because the chromosomes failed to segregate properly, and the apoptosis rate in these cells gradually increased, accompanied by increased caspase-3 activation and anti-poly (ADP ribose) polymerase cleavage. Apoptosis caused by Zwint-1 deficiency was demonstrated to occur through caspase-dependent pathways based on experiments involving treatment with a pan-caspase inhibitor (Z-VAD-Fmk). Thus, Zwint-1 contributes to cell growth, invasion, and survival through NF-κB signaling pathways, suggesting that it could serve as a PC biomarker and new therapeutic target.
CCANKMNNF-κBRZZZwint-1cancer biologypancreatic cancer
Figures
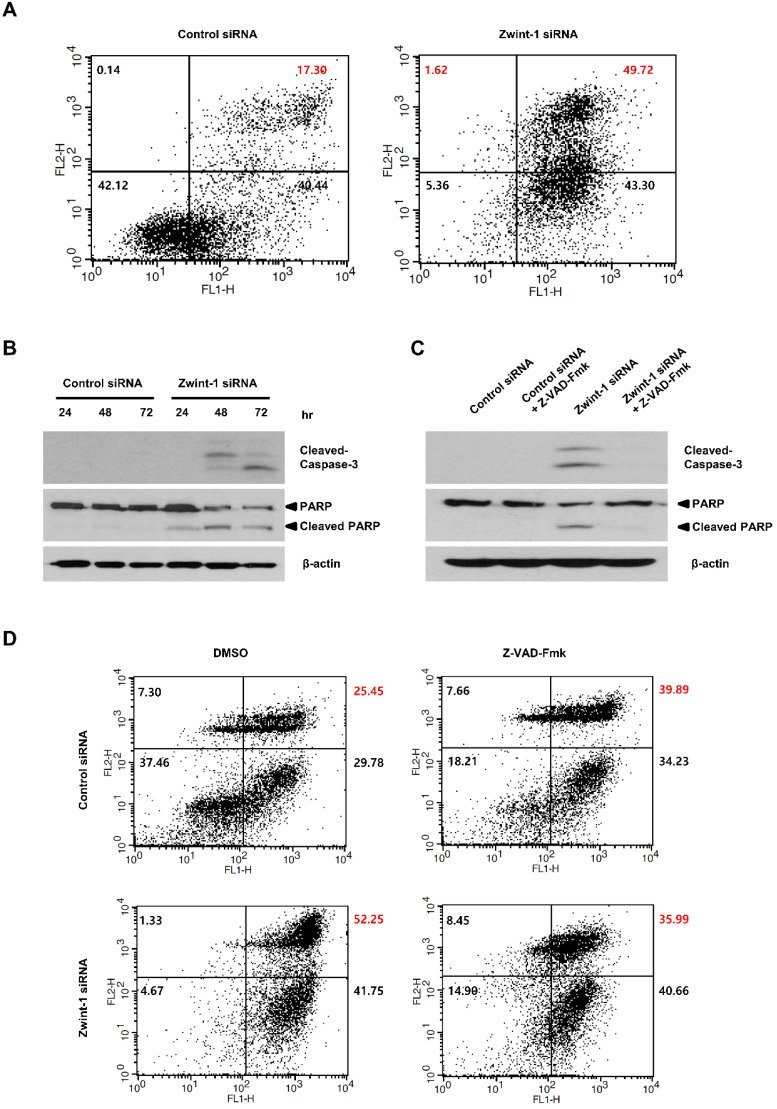
Figure 1Zwint-1 expression is elevated in PC tissues and cell lines. (A) Zwint-1 expression levels in PC tissues (n = 179) and normal tissues (n = 171). (B) OS based on the TCGA database. Each dot represents the Zwint-1 expression level in one sample. The OS of PC patients with low or high Zwint-1 expression levels was analyzed by the Kaplan-Meier method and a log rank test. The high dotted line demarcates samples with higher expression levels than the median value of TPM (the high expression cohort), whereas the low dotted line demarcates samples with lower expression levels than the median value of TPM (the low expression cohort). Median values are indicated by solid lines. *P < 0.005. TCGA, The Cancer Genome Atlas; TPM, transcripts per million; OS, overall survival; HR, hazard ratio. (C) Zwint-1 protein expression analyzed by western blotting in HPDE cells and different PC cell lines (AsPC-1, PANC-1, MIA PaCa-2, and Capan-1 cells). Cell lysates were immunoblotted with the indicated antibodies. (D) Levels of Zwint-1 protein expression in HPDE and PC cell lines. The Zwint-1/β-actin ratio was determined by densitometric analysis using ImageJ software. Error bars represent standard deviations of the means of three biological replicates. Values represent means ± SEMs. *P < 0.005, **P < 0.001. Results were analyzed by one-way analysis of variance followed by Bonferroni's multiple comparison tests.Figure 2Zwint-1-deficient PC cells show reduced proliferation and colony formation mediated by NF-κB signaling. (A) MIA PaCa-2 cells were transfected with two different siRNA constructs to knock down Zwint-1 expression, and the expression levels of Zwint-1 protein were measured 48 h later by western blotting.(B) Colony formation assays on MIA PaCa-2 cells transfected with control or one of two Zwint-1 siRNAs (Zwint-1 siRNA_1 and siRNA_2). (C) Colony formation assays in PANC-1 and Capan-1 cells transfected with control siRNA and Zwint-1 siRNA_2. Values represent means ± SEMs. Results were analyzed using unpaired t-tests. ***P < 0.0001. (D) MTT assays to determine the proliferation of control and Zwint-1-deficient PC cells for 3 or 7 d. Curves were constructed based on biological triplicates with values expressed as means ± SEMs. ***P < 0.0001. Results were analyzed by two-way analysis of variance with Bonferroni's multiple comparison tests. (E) Western blotting to determine the levels of Zwint-1, p-NF-κB (Ser536), NF-κB p65, Cyclin D1, and β-actin in MIA PaCa-2 cells after transfection with control or Zwint-1 siRNA at 24 h. (F) Western blotting to determine the levels of Zwint-1, c-IAP1, c-IAP2, XIAP, and β-actin in MIA PaCa-2 cells after transfection with control or Zwint-1 siRNA at 48 h.Figure 3Zwint-1-deficient PC cells show reduced migration, invasion, and wound healing abilities due to MMP2 and MMP9 inhibition. (A) Migration and (B) invasion assays of MIA PaCa-2 cells transfected with control or Zwint-1 siRNA at 24 h. (C) Wound-healing assays of MIA PaCa-2 cells transfected with control or Zwint-1 siRNA for 24-72 h. Values represent means ± SEMs. Results were analyzed using unpaired t-tests. ***P < 0.0001. (D) Western blotting to determine the levels of Zwint-1, MMP2, MMP9, and β-actin in MIA PaCa-2 cells after transfection with control or Zwint-1 siRNA at 48 h.Figure 4Zwint-1-deficient PC cells are arrested in the G2/M phase and undergo apoptosis. (A) MIA PaCa-2 cells were transfected with control or Zwint-1 siRNA and then subjected to flow cytometric analysis at 24, 48, and 72 h. The flow cytometry plots and data are representative of at least three separate experiments. (B) Percentages of cells in subG1 (apoptosis, red), G1 (blue), S (orange), and G2/M (green) phases. (C) Western blotting to determine the levels of Zwint-1, cyclin A2, p-histone H3, and β-actin in MIA PaCa-2 cells after transfection with control or Zwint-1 siRNA for 24, 48, and 72 h. (D) Spindle structures were visualized by immunofluorescent staining for CREST (green), a-tubulin (red), and DNA (blue). (E) Comparison of mitosis frequency in Zwint-1 siRNA-transfected cells versus control siRNA-transfected cells.(F) Comparison of aberrant anaphase frequencies in Zwint-1-trasnfected siRNA cells versus those in control siRNA-transfected cells. Values represent means ± SEMs. Results were analyzed using unpaired t-tests. **P < 0.001, ***P < 0.0001.Figure 5Zwint-1-deficient PC cells undergo apoptosis induced by a caspase-dependent pathway. (A) Apoptosis was measured by annexin V staining followed by flow cytometry. The lower left (LL) quadrant shows live cells, the lower right (LR) shows early-apoptotic cells, and the upper right (UR) shows late-stage apoptotic cells. (B) Western blotting to determine the levels of cleaved-caspase-3, PARP, and β-actin in MIA PaCa-2 cells after transfection with control or Zwint-1 siRNA for 24, 48, and 72 h. (C) Western blot analysis to determine the levels of caspase-3, PARP, and β-actin in MIA PaCa-2 cells after transfection with control or Zwint-1 siRNA with or without Z-VAD-Fmk (20 μM) treatment for 72 h. (D) Apoptosis measured by annexin V staining followed by flow cytometry. Cells were treated with Z-VAD-Fmk (20 µM) for 72 h.
그림 출처: PubMed Central 공개 논문 (PMC7477444)
Conflict of interest statement
Competing Interests: The authors have declared that no competing interest exists.