Department of Biochemistry, College of Veterinary Medicine, BK 21 PLUS, Seoul National University, Seoul 08826, South Korea.
Department of Biology, Massachusetts Institute of Technology, Cambridge, MA 02139, United States.
Broad Institute of MIT and Harvard, Cambridge, MA 02139, United States.
Massachusetts General Hospital Cancer Center, Charlestown, MA 02129, United States.
Department of Internal Medicine, Seoul National University Bundang Hospital, Seongnam 13620, South Korea.
Department of Internal Medicine, Seoul National University College of Medicine, Seoul 03080, South Korea.
Department of Thoracic and Cardiovascular Surgery, Seoul National University Bundang Hospital, Seongnam 13620, South Korea.
Department of Thoracic and Cardiovascular Surgery, Seoul National University College of Medicine, Seoul 03080, South Korea.
Comparative Medicine Research Center, Seoul National University, Seoul 08826, South Korea.
Abstract
While the link between serum proteins and cancer has been studied in an effort to enable early-stage cancer detection, factors that might perturb this link has been poorly understood. To ask this question, we performed serum protein profiling on a prospective cohort of 601 individuals with or without lung, pancreatic, or colorectal cancers and identified ten distinct serum protein signatures with distinct link to the patient metadata. Importantly, we discovered that a positive history of alcohol consumption is a major factor that diminishes the sensitivity of serum protein-mediated liquid biopsy in early-stage malignancies, resulting in a 44% decline in the sensitivity of detecting American Joint Committee on Cancer (AJCC) stage I malignancies. Our data provide evidence that patient lifestyle can affect the sensitivity of liquid biopsy and suggest the potential need for abstinence from alcohol before measurement during serum protein-based cancer screening.
AlcoholBiomarkerCancerColorectal cancerLung cancerPancreatic cancerSerum protein
Figures
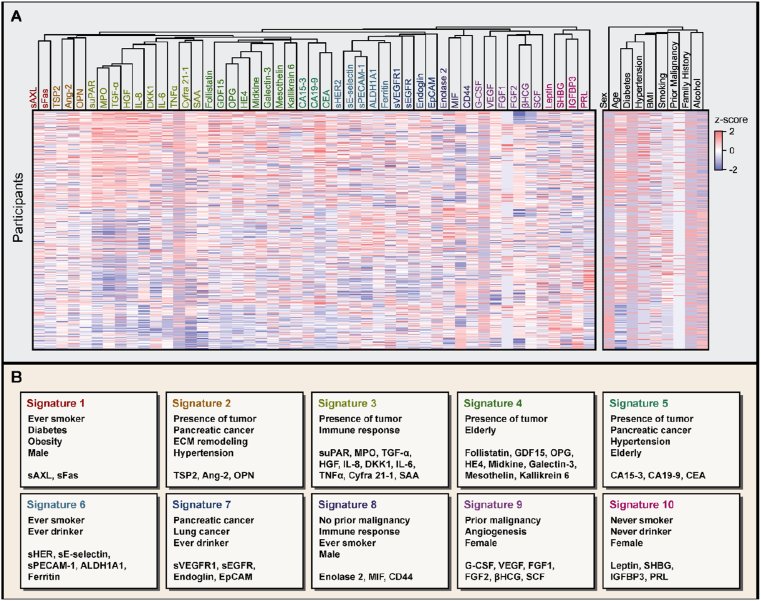
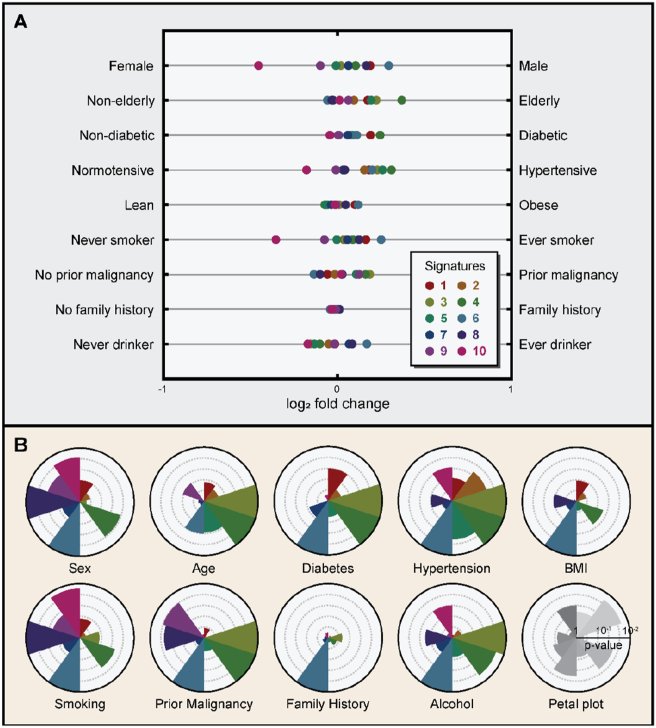
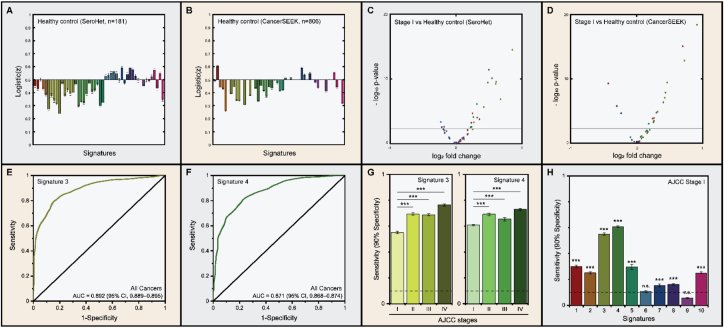
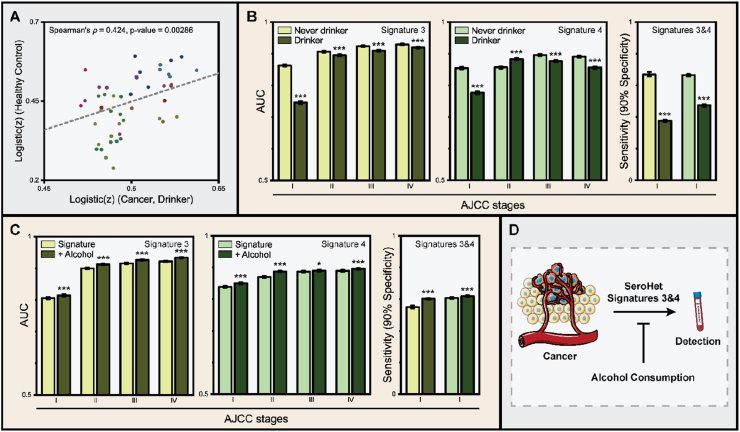
Figure 1Multicancer cohort reveals ten prominent serum protein signatures. (A) Heatmap of serum protein concentrations and individual metadata in the cohort. Each column has been hierarchically clustered using the Euclidean distance. Ten co-regulated signatures of serum proteins are color-coded. Each row represents 586 participants who met the inclusion criteria. (B) Signatures and their signature-specific attributes. Members of each signature are presented in panels. SeroHet signatures encompassed expansive aspects of cancer biology, including stage, cancer type, immune response, angiogenesis, and extracellular matrix remodeling.Figure 2Association of signatures to patient metadata. (A) Forest plot showing the log2 fold changes for each signature. Signatures are color-coded and represented as a single dot. Each row represents different types of patient metadata studied. (B) Petal plot showing the −log10 p-values for each signature. The scale of the axis is indicated in the bottom right. Each signature is presented in a clockwise order, beginning from the top. Signatures are color-coded. The outermost circle represents the threshold for the statistical significance (p-value < 0.01).Figure 3Early-stage cancer detection by signatures. (A) Logistic(z) values of healthy individuals compared to cancer patients in the current study. (B) Logistic(z) values of healthy individuals compared to cancer patients in CancerSEEK cohort. Signatures 2–5 were underrepresented in healthy individuals compared to cancer patients in both cohorts. (C) Volcano plot between clinical stage I cancer patients and healthy individuals without cancer in SeroHet cohort. The horizontal axis indicates the log2 fold change in the normalized protein concentration of AJCC stage I cancers compared to healthy individuals. (D) Volcano plot between clinical stage I cancer patients and healthy individuals without cancer in CancerSEEK cohort. The horizontal axis indicates the log2 fold change in the normalized protein concentration of AJCC stage I cancers compared to healthy individuals. Horizontal line represents the Bonferroni-corrected threshold for p-value at a target family-wise error rate of 0.05. Upregulation of signatures 3 and 4 in clinical stage I cancer patients are evident in both cohorts. (E) ROC curves on the detection of cancer using SeroHet signature 3. AUC value of the curve was 0.892 (95% CI, 0.889–0.895). (F) ROC curves on the detection of cancer using signature 4. AUC value of the curve was 0.871 (95% CI, 0.868–0.874). (G) Average sensitivity at 90% specificity of detecting cancer with each AJCC stage using signatures 3 and 4. The sensitivity of the classifier positively correlated with cancer progression in both cases. (H) Average sensitivity at 90% specificity of detecting AJCC stage I cancer using each signature. SeroHet signatures 3 and 4 were highly diagnostic of cancer at AJCC stage I. Error bar, 95% CI.Figure 4Alcohol consumption perturbs cancer detection by liquid biopsy. (A) Correlation between serum protein profiles of healthy individuals without cancer and cancer patients with the history of chronic alcohol intake. Spearman's ρ was 0.424 (p-value = 0.00286), indicating that ever-drinker with cancer phenocopy healthy individuals without cancer. (B) Performance of cancer detection using signatures 3 and 4 by the history of alcohol consumption. Individuals with positive history of chronic alcohol intake underperformed in these blood tests. (C) Performance of cancer detection with and without the binary parameter on the history of chronic alcohol consumption. The inclusion of the parameter enhanced the performance of blood tests in all stages. (D) Schematic diagram illustrating the effect of chronic alcohol consumption in liquid biopsy-based cancer detection. Error bar, 95% CI.