School of Biological Sciences and Institute for Molecular Biology and Genetics, Seoul National University, Seoul, South Korea.
Department of Internal Medicine, Seoul National University College of Medicine, Seoul National University Hospital, Seoul, South Korea.
Department of Physics, Pohang University of Science and Technology (POSTECH), Pohang, South Korea.
Department of Biomarker Discovery, PROTEINA Co., Ltd, Seoul, South Korea.
Department of Internal Medicine, Seoul National University College of Medicine, Seoul National University Hospital, Seoul, South Korea. go01@snu.ac.kr.
School of Biological Sciences and Institute for Molecular Biology and Genetics, Seoul National University, Seoul, South Korea. tyyoon@snu.ac.kr.
Department of Biomarker Discovery, PROTEINA Co., Ltd, Seoul, South Korea. tyyoon@snu.ac.kr.
Abstract
B-cell-lymphoma-2 (BCL2) homology-3 (BH3) mimetics are inhibitors of protein-protein interactions (PPIs) that saturate anti-apoptotic proteins in the BCL2 family to induce apoptosis in cancer cells. Despite the success of the BH3-mimetic ABT-199 for the treatment of haematological malignancies, only a fraction of patients respond to the drug and most patients eventually develop resistance to it. Here we show that the efficacy of ABT-199 can be predicted by profiling the rewired status of the PPI network of the BCL2 family via single-molecule pull-down and co-immunoprecipitation to quantify more than 20 types of PPI from a total of only 1.2 × 10⁶ cells per sample. By comparing the obtained multidimensional data with BH3-mimetic efficacies determined ex vivo, we constructed a model for predicting the efficacy of ABT-199 that designates two complexes of the BCL2 protein family as the primary mediators of drug effectiveness and resistance, and applied it to prospectively assist therapeutic decision-making for patients with acute myeloid leukaemia. The characterization of PPI complexes in clinical specimens opens up opportunities for individualized protein-complex-targeting therapies.
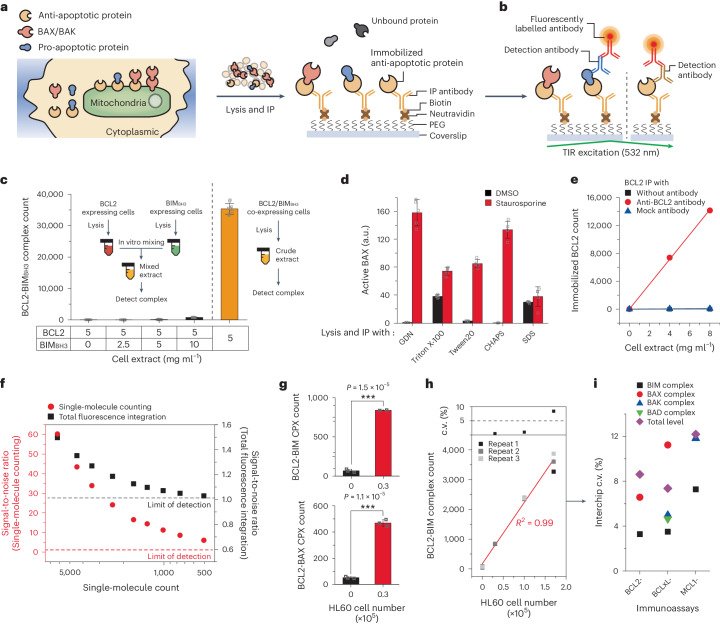
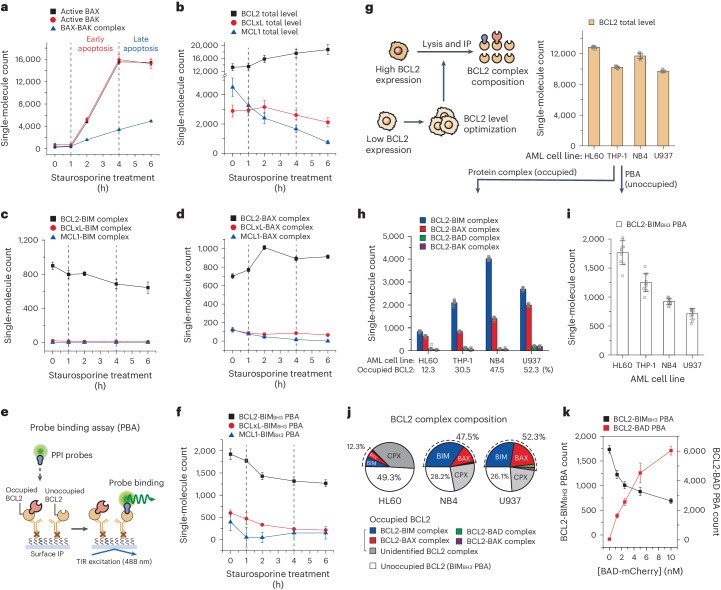
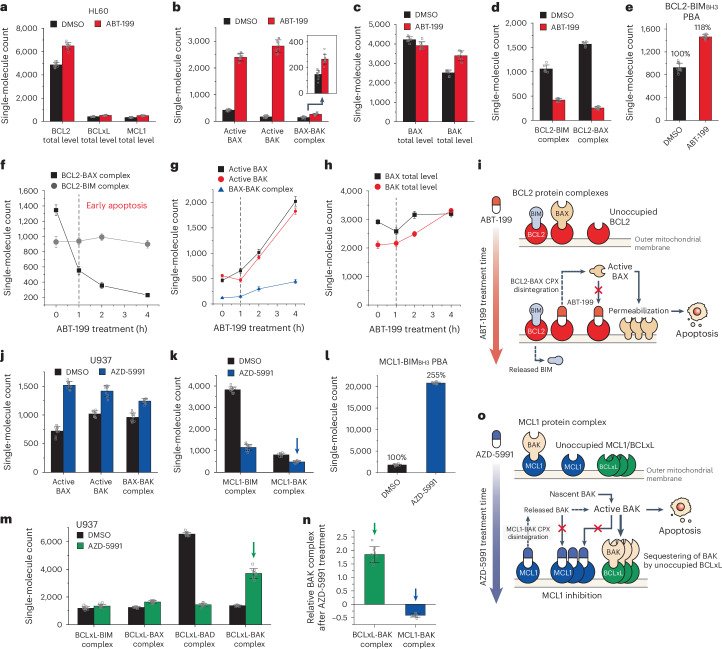
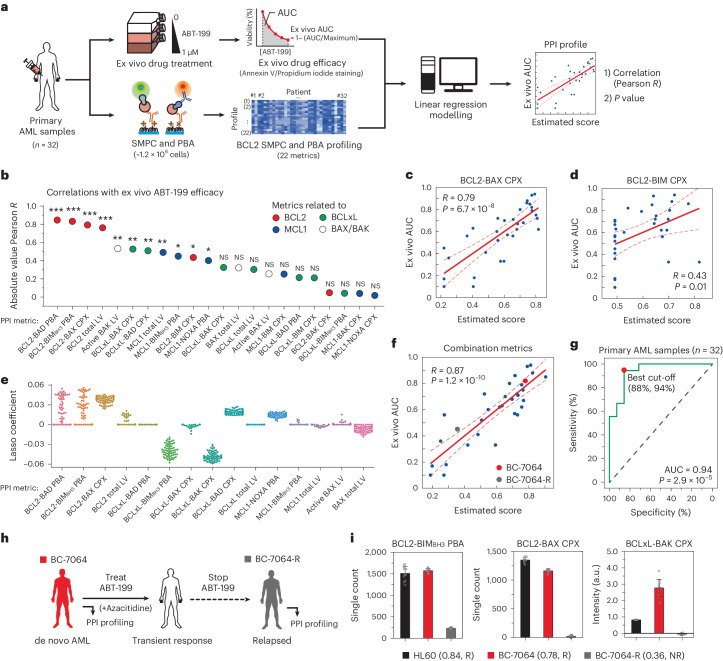
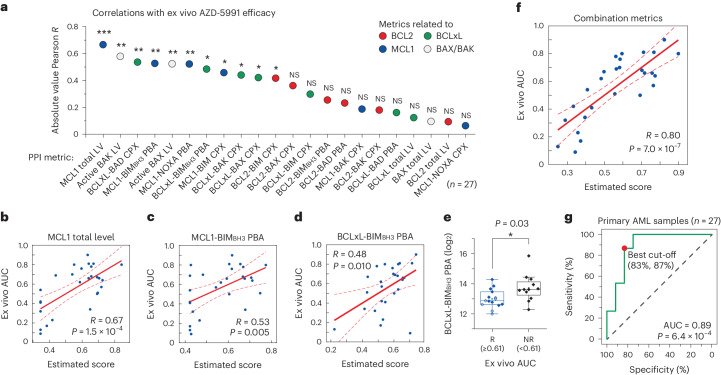
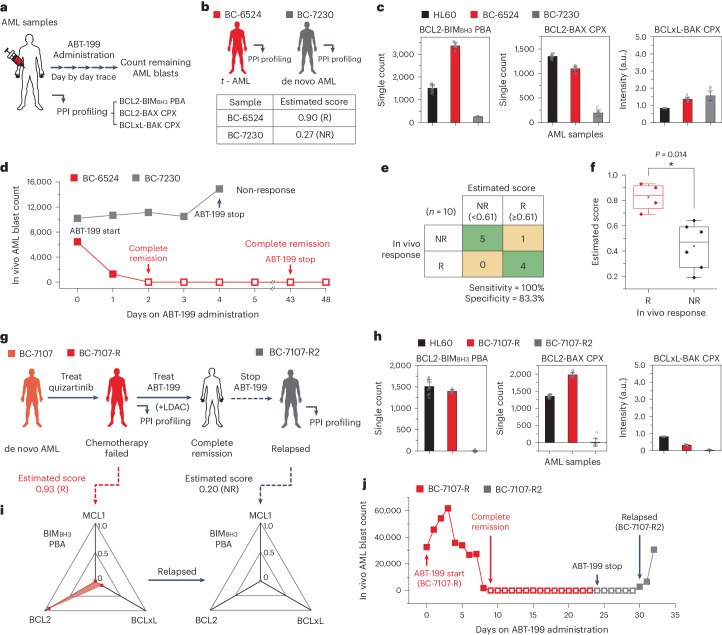
Fig. 1 Profiling BCL2-family protein complexes using the SMPC technique. a, Schematic for the surface IP of BCL2-family proteins. Anti-apoptotic proteins in cell extracts were immobilized onto the surface of the reaction chamber. b, Schematic of immunoassay selectively detecting protein complexes (left) and the total level of surface bait protein (right). The fluorescence signals from detection antibodies were imaged under total internal reflection (TIR) excitation. c, Comparison of the formation of model BCL2-BIMBH3 complex in an intracellular environment by BCL2-mCherry/BIMBH3-eGFP co-expression (right) and in vitro mixing of two individual extracts with each expressing BCL2-mCherry and BIMBH3-eGFP (left) (n = 10 independent images). d, Changes in active BAX level measured for staurosporine-treated HL60 cells after lysis and IP with different detergent types (n = 5 independent images). e, Single-molecule count of surface-immobilized BCL2-eGFP from the crude extract with indicated IP antibodies (n = 10 independent images). f, Comparison of signal-to-noise ratio between single-molecule counting analysis and integration of total fluorescence signals. g, Counts of endogenous BCL2 protein complexes from the 30,000 HL60 cells by using immunoassay (n = 3 biological replicates) (two-sided two-sample t-test, ***P = 1.5 × 10⁻⁵, 1.1 × 10⁻⁵). h, Counts of endogenous BCL2-BIM complexes and interchip c.v.s from the fixed numbers of HL60 cells (n = 3 biological replicates). i, Interchip c.v.s obtained from independent interchip measurement for all immunoassays and cell numbers (n = 3 biological replicates). Data represent means ± s.d. Source dataFig. 2 Tracking the PPI profile changes to intrinsic apoptotic stress and assessment of potential PPIs with PBA. a–d, Changes in endogenous BCL2-family PPI profiles of HL60 cells through apoptosis progression by 2 μM of staurosporine. Active BAX/BAK level (a), total levels of anti-apoptotic proteins (b), BIM complexes (c), BAX complexes (n = 10 independent images) (d). e, Schematic of the PBA to measure the unoccupied populations of surface-immobilized anti-apoptotic proteins. f, Changes in BIMBH3 PBAs for anti-apoptotic proteins from HL60 cells through apoptosis progression by staurosporine (n = 10 independent images). g, Schematic of the comparison of the BCL2 protein complex compositions in different AML cell lines (left). The density of surface-immobilized BCL2 was constantly maintained by optimizing the total protein concentration of crude cell extracts in all AML cell lines (right) (n = 10 independent images). h–j, Compositions of the BCL2 PPI profiles in AML cell lines. BCL2 protein complexes (h), BCL2-BIMBH3 PBA (n = 10 independent images) (i), integrated BCL2 complex compositions (j). k, Changes in BCL2-BIMBH3 PBA and BCL2-BAD PBA with increasing amounts of BAD probe (n = 10 independent images). BIMBH3 probe was presented at 10 nM. The single-molecule counts were rescaled to account for the labelling efficiencies of the immunoassays calculated in Extended Data Fig. 5. Data represent means ± s.d. Source dataFig. 3 Changes in the BCL2-family protein complexes provoked by BH3 mimetics. a–e, Changes in BCL2-family PPI profiles in HL60 cells after ABT-199 treatment (100 nM, 24 h). Total levels of anti-apoptotic proteins (a), active BAX/BAK level (b), total levels of BAX/BAK (c), BCL2 complexes (d), BCL2-BIMBH3 PBA (n = 10 independent images) (e). f–h, Changes in BCL2-family PPI profile in HL60 cells after higher concentration of ABT-199 treatment (300 nM, 4 h). BCL2 complexes (f), active BAX/BAK level (g), total levels of BAX/BAK (n = 10 independent images) (h). i, Schematic illustration of the mode of action of ABT-199. j–n, Changes in BCL2-family PPI profiles in U937 cells after AZD-5991 treatment (100 nM, 24 h). Active BAX/BAK level (j), MCL1 complexes (k), MCL1-BIMBH3 PBA (l), BCLxL complexes (n = 10 independent images) (m), comparison of relative changes in BAK complexes after AZD-5991 treatment (n). The relative changes were obtained from the data indicated in k and m normalized to BCLxL- or MCL1-total level. o, Schematic illustration of the mode of action of AZD-5991. The single-molecule counts were rescaled to account for the labelling efficiencies of the immunoassays calculated in Extended Data Fig. 5 (d,k,m). Data represent means ± s.d. Source dataFig. 4 Constructing an analysis model for ABT-199 efficacy with multidimensional BCL2 SMPC and PBA profiling. a, Schematic for generating linear regression correlation between ex vivo efficacy of ABT-199 and PPI profiles from primary AML samples. The collected AML cells were cultured and treated with 0–1 μM of ABT-199, and the AUCs of cell viability were obtained as ex vivo drug efficacy (top). Approximately 1.2 × 10⁶ of primary AML cells on the same cohort underwent PPI profiling with the SMPC (bottom). b, The absolute Pearson correlations between ex vivo AUC of ABT-199 and PPI metrics for primary AML samples (one-sided F-test, *P < 0.05, **P < 0.01, ***P < 0.001, NS, not significant; P values are provided as Source Data) (n = 32). c,d, Correlations between ex vivo AUC and single BCL2-related PPI metrics. BCL2-BAX CPX (coefficient: 0.157, P = 6.7 × 10⁻⁸) (c), BCL2-BIM CPX (coefficient: 0.013, P = 0.01) (one-sided F-test) (d). e, Lasso coefficients of PPI profiles correlated with ex vivo AUC of ABT-199 for primary AML samples (67 models). f, Correlation between ex vivo AUC and the combination of multiple PPI metrics (BCL2-BIMBH3 PBA, BCL2-BAX CPX and BCLxL-BAK CPX) (one-sided F-test, P = 1.2 × 10⁻¹⁰). g, ROC curve between the estimated score and the ex vivo efficacy (two-sided t-test, P = 2.9 × 10⁻⁵). h, Clinical features and the ABT-199 administration history of BC-7064. i, Comparison of the PPI profiles and the estimated scores with PPI diagnostic results from the initial and the relapsed BC-7064 samples (R, responsive; NR, non-responsive) (n = 10 independent images). Data represent means ± s.d. Source dataFig. 5 Construction of an MCL1 inhibitor efficacy model. a, The absolute Pearson correlations between ex vivo AUC of AZD-5991 and PPI profiles for primary AML samples (*P < 0.05, **P < 0.01, ***P < 0.001; P values are provided as Source Data) (n = 27). b–d, Correlations between ex vivo AUC and single PPI metrics. MCL1 total level (coefficient: 0.05, P = 1.5 × 10⁻⁴) (b), MCL1-BIMBH3 PBA (coefficient: 0.04, P = 0.005) (c), BCLxL-BIMBH3 PBA (coefficient: −0.13, P = 0.010) (one-sided F-test) (d). e, Comparison of BCLxL-BIMBH3 PBA counts for the AZD-5991 to responsive (ex vivo AUC ≥ 0.61, n = 12) and non-responsive (ex vivo AUC < 0.61, n = 15) AML samples (two-sided two-sample t-test, P = 0.03). For the boxplots, the centre line represents the median, the box limits are the upper and lower quartiles, and the whiskers represent 1.5× interquartile range. f, Correlation between ex vivo AUC and the combination of multiple PPI metrics (MCL1 total level, BCLxL-BIMBH3 PBA, BCLxL-BAK CPX) (one-sided F-test, P = 7.0 × 10⁻⁷). g, ROC curve between the estimated score and the ex vivo efficacy (two-sided t-test, P = 6.4 × 10⁻⁴). Source dataFig. 6 Using the PPI analysis model as a predictive biomarker for in vivo ABT-199 response. a, Schematic of the study. Complete blood cell count analysis was carried out on a daily basis to count the number of AML blasts in the primary AML samples. b–d, Comparison of the PPI profiles from the BC-6524 and BC-7230 samples. Clinical features and the estimated scores with PPI diagnostic results for ABT-199 (b), comparison of BCL2-family PPI profiles (n = 10 independent images) (c), changes in in vivo AML blast counts through the days after ABT-199 administration (d). e, Confusion matrix for the drug response prediction based on the estimated score and the in vivo drug responses (n = 10). f, Comparison of the estimated scores of patients with AML between responsive (n = 4) and non-responsive (n = 6) patients for in vivo ABT-199 administration (two-sided Mann–Whitney test, *P = 0.014). For the boxplots, the centre line represents the median, the box limits are the upper and lower quartiles, and the whiskers represent 1.5× interquartile range. g, Clinical features and the ABT-199 administration history of BC-7107. h, Tracking the changes in BCL2-family PPI profiles after relapse of BC-7107-R (n = 10 independent images). i, Tracking the changes in BIMBH3 PBA profiles and PPI diagnostic results after relapse of BC-7107-R. The data were normalized to the BCL2-BIMBH3 PBA level of HL60 cells. j, Changes in in vivo AML blast counts from BC-7107-R through the days after ABT-199 administration. The estimated scores were calculated from the model in Fig. 4f (b,g). Data represent means ± s.d. Source dataExtended Data Fig. 1 Development of single-molecule pull-down and co-IP (SMPC) to profile BCL2-family proteins. a-c, Selection of monoclonal antibodies for surface immunoprecipitation (IP). Surface IP of eGFP-labeled target anti-apoptotic proteins from transfected HEK293T crude cell extracts. Crude cell extracts with 1 nM of eGFP-labeled anti-apoptotic protein were used to IP. (a) BCL2 IP antibody, (b) BCLxL IP antibody, (c) MCL1 IP antibody (n = 10 independent images). d-f, Selection of monoclonal antibodies for total level immunoassay of surface-immobilized target anti-apoptotic proteins. (d) BCL2 detection antibody, (e) BCLxL detection antibody, (f) MCL1 detection antibody (n = 10 independent images). g, Relative model BCL2-BIMBH3 complex from BCL2-mCherry/BIMBH3-eGFP co-transfected HEK293T cells after the lysis with different detergent types (n = 10 independent images). h, Detection of surface-immobilized BAK fragments by using the monoclonal antibody AT38E2. Crude cell extracts with 1 nM of eGFP-labeled BAK fragments were used to IP (n = 10 independent images). The data were normalized to the BAK level of 24-69 (α1) fragments. i, Activation of BAK from HL60 and Ramos cells by heat or triton X-100 treatment to crude cell extracts. The data were normalized to the active BAK level of non-treated HL60. j, Schematics for the preparation of HL60 samples with different preservation conditions. k,l, Comparison of the PPI profiles across the sample states using SMPC platform. (k) BCL2 total level, (l) BCL2-BAX complex (n = 10 independent images). Error bars represent means±s.d. Source dataExtended Data Fig. 2 Post-image analysis for counting the number of single-molecule fluorescence spots. a, Setting the cutoff to eliminate background signals for post image analysis. We used 8 to 10 control images captured with a 100 ms time resolution from empty reaction chambers to establish a background limit. The background limit (cutoff=1,015 A.U.) was determined from the signal distribution recorded in each pixel of the control images, effectively eliminating 99% of background signals. b, Identification of diffraction-limited fluorescence spots. Three sequential images captured with a 300 ms time frame were averaged to create a single image upon subtracting the background. From the averaged image, the number of diffraction-limited fluorescence spots were counted (single-molecule counting). c, Identified single-molecule counts and integration of individual pixel signals of the imaging area (total fluorescence integration) from the analyzed TIRF images. The TIRF images were obtained by surface IP of BCLxL-eGFP expressed in HEK293T cell extracts (Scale bar: 10 μm) (a-c). d-g, Calibration of single-molecule count from the total fluorescence integration. (d) Single-molecule count dependent on the total fluorescence integration of surface-immobilized BCL2-mCherry obtained from the analyzed images (Scale bar: 10 μm). (e) Photobleaching kinetics of surface-immobilized BCL2-mCherry signals depending on the bleaching time. (f) The linear correlation between single-molecule count and total fluorescence integration of surface-immobilized BCL2-mCherry after photobleaching. (g) Calibration of single-molecule count from total fluorescence integration by extrapolating. The linear correlation was obtained in (f). The TIRF images were obtained by surface IP of BCL2-mCherry expressed in HEK293T cell extracts (d-g). Source dataExtended Data Fig. 3 Attesting the stability of the SMPC platform by inter-chip measurements of immunoassays. a, Counts of BCL2-related immunoassays (BCL2-BIM complex, BCL2-BAX complex, BCL2 total level) from the fixed numbers of HL60 cells (n = 3). b, Counts of BCLxL-related immunoassays (BCLxL-BIM complex, BCLxL-BAX complex, BCLxL-BAD complex, BCLxL-BAK complex, BCLxL total level) from the fixed numbers of PC9 cells (n = 3). c, Counts of MCL1-related immunoassays (MCL1-BIM complex, MCL1-BAK complex, MCL1 total level) from the fixed numbers of PC9 cells (n = 3). The single-molecule counts were rescaled to account for the labeling efficiencies of the immunoassays calculated in Extended Data Fig. 5 as well as the specific incubation conditions for direct comparison. All data were measured from independent inter-chip experiments. CVs obtained from independent inter-chip measurement for all the immunoassays and cell numbers (n = 3). Individual data points shown for independent biological replicates. Source dataExtended Data Fig. 4 Tracking the response of HL60 cells under apoptotic stress. a, Schematics for the intracellular PPI profile changes (left), and the result of flow cytometry analysis after Annexin V/Propidium iodide staining through the progression of apoptosis pathway (right). Viability represents the double negative populations after Annexin V/Propidium iodide staining and analyzed with flow cytometry. b,c, Population changes of HL60 cells at different time points through the treatment of drug with Annexin V/Propidium iodide staining. (b) 2 μM of staurosporine, (c) 300 nM of ABT-199. Source dataExtended Data Fig. 5 Relatively comparing the normalized efficiencies of different immunoassays. a, Comparing relative efficiencies of IP antibodies for anti-apoptotic proteins. 1 nM of eGFP-labeled anti-apoptotic proteins were immobilized on the surface by the matched IP antibodies respectively, and the eGFP signals were compared (n = 10 independent images). b, Comparing relative efficiencies of immunolabeling antibodies for anti-apoptotic proteins. The surface immobilized anti-apoptotic protein in (a) were immunolabeled by the matched labeling antibodies respectively, and the relative efficiencies for total level assays were compared (n = 10 independent images). c, Comparing relative immunolabeling efficiencies of detection antibodies for BCL2 family proteins. 1 nM of eGFP-labeled BCL2 family proteins were immobilized on the surface by the anti-eGFP antibody and detected with matched detection antibodies for immunolabeling. The relative immunolabeling efficiencies of the detecting antibodies were calculated based on the ratio of labeled proteins to the total number of proteins immobilized on the surface (n = 10 independent images). The data were normalized to the efficiencies of BCL2 IP assay, BCL2 total level assay, and BCL2 immunolabeling antibody, respectively (a-c). Error bars represent means±s.d. Source dataExtended Data Fig. 6 Population profile of PPI probes binding onto unoccupied BCL2 and the cartoon schematic of the experiment. a-d, PBA binding curves for each PPI probes (eGFP-labeled BIMBH3, BIMEL, BAD, NOXA) to anti-apoptotic proteins (mCherry-labeled BCL2, BCLxL, MCL1) to calculate dissociation constant (Kd). (a) BIMBH3-PBA, (b) BIMEL-PBA, (c) BAD-PBA, (d) NOXA-PBA. e, Comparison of the binding affinities between each binding pairs. f, Correlations between the calculated Kd values and the occupancy values at a fixed PPI probe concentration. g, Dissociation of BCL2-BIM complex after in vitro competition by BAD-eGFP PPI probes (n = 10 independent images). Protein complexes were surface-immobilized by anti-BCL2 IP antibody and detected with anti-BIM detection antibody after the competition. h, Schematic of in vitro PBA competition between BIMBH3-eGFP PPI probe and competitors (PPI probe or BH3 mimetics) on surface-immobilized BCL2 proteins. i, Remained BCL2-BIMBH3 PBA after in vitro binding competition with BH3 mimetics (ABT-199, AZD-5991, WEHI-539). BIMBH3 PPI probe was presented in 10 nM. j,k, BCL2 PBA counts with different PPI probes from four AML cell lines. (j) BCL2-BIMEL PBA, (k) BCL2-BAD PBA (n = 10 independent images). l, Schematic for selective binding of PPI probes for unoccupied BCL2 proteins. Error bars represent means±s.d. Source dataExtended Data Fig. 7 BIMBH3 PBA profile predicts response of single-agent BH3 mimetics on leukaemia cell lines. a, BIMBH3 PBA profiles of four different leukemia cell lines. The BIMBH3 PBA levels were rescaled to account for the relative PBAs of BIMBH3 probe for anti-apoptotic proteins determined in Extended Data Fig. 6a. The data were normalized to the BCL2-BIMBH3 PBA level of HL60 cell. b,c, Viability of leukemia cell lines after treatment of BH3 mimetics for 24 hours. (b) ABT-199, (c) AZD-5991. Source dataExtended Data Fig. 8 Development of the ex vivo drug-efficacy prediction model by using combinations of multiple PPI metrics. a, Comparison of BCL2 family PPI profiles from the healthy donor PBMC sample and HL60 cells with SMPC (n = 10 independent images). The data were normalized to the HL60 cell. b, Correlation between ex vivo AUC for ABT-199 and combination of BCL2-related metrics (BCL2 total level, BCL2-BIMBH3 PBA, BCL2-BAD PBA, and BCL2-BAX CPX) (One-sided F-test, p-value = 1.3e-10). c, Linear correlations between two different BCL2 PBA metrics. d, Correlations between ex vivo AUC and IC50 of primary AML samples for ABT-199 (n = 32). e, Schematic of Lasso regression analysis for the selection of PPI metrics highly correlated with drug response. The training and test groups were randomly selected from the primary AML sample cohort. The Lasso regression models were generated using the training group and evaluated based on Pearson’s R as well as prediction outcomes for the test group. 67 models were selected from 10,000 different initial models. f, Identification of outliers in the ABT-199 drug efficacy prediction models. The residuals of each outlier in the model (ex vivo AUC – estimated score) were indicated. g, Correlations between ex vivo AUC and IC50 of primary AML samples for AZD-5991 (n = 27). h, Correlation between ex vivo AUC for AZD-5991 and combination of MCL1-related metrics (MCL1 total level, MCL1-BIMBH3 PBA, MCL1-NOXA PBA, and MCL1-BAK CPX) (One-sided F-test, p-value = 2.5e-5). Source dataExtended Data Fig. 9 Comparison of BCL2 SMPC and PBA PPI profiling and different methods to predict responses to BH3 mimetics. a, Schematic for BH3 profiling based on JC-1 staining, and measurement of BCL2 levels using flow cytometry or western blotting for primary AML samples. b,c, BH3 profiling on HL60 cells. (b) Relative fluorescence units (RFU) of 590 nm wavelength for HL60 cells through the treatment of BH3 peptides or BH3 mimetics, (c) Depolarization of HL60 cells through the BH3 profiling. Depolarization by 10 μM of BAD peptides was indicated. d,e, Correlations for ex vivo ABT-199 AUC with (d) depolarizations by BAD (10 μM) – HRK (10 μM) peptides, (e) combination of multiple PPI metrics (BCL2-BIMBH3 PBA, BCL2-BAX CPX, and BCLxL-BAK CPX). The outliers identified in model (d) were indicated (n = 14) (One-sided F-test, p-value = 0.011, 8.1e-05). f,g, ROC curves for ex vivo ABT-199 responses with (f) depolarizations by BAD (10 μM) – HRK (10 μM) peptides, (g) Combination of multiple PPI metrics (Two-sided t-test, p-value = 0.07, 0.009). h, Correlations between BCL2 protein levels determined by SMPC and flow cytometry for primary AML samples (n = 14). i, Prediction models for ABT-199 ex vivo AUC with BCL2 protein levels determined by flow cytometry (One-sided F-test, p-value = 0.077). j, Correlations between BCL2 protein levels determined by SMPC and western blotting for primary AML samples (n = 32). The raw blot image is provided as a Source Data. k, Prediction models for ABT-199 ex vivo AUC with BCL2 protein levels determined by western blotting (One-sided F-test, p-value = 0.0003). Source dataExtended Data Fig. 10 Longitudinal tracking of in vivo ABT-199 responses in patients with AML. a-g, Changes of in vivo AML blast counts or AML blast ratio through the days after ABT-199 administration. The estimated scores and the PPI diagnostic results (R: Responsive, NR: Non-responsive) were obtained from the model in Fig. 4f. (a) BC-7052, (b) BC-8634, (c) BC-8784, (d) BC-7081, (e) BC-9458, (f) BC-7064, (g) BC-7082. The BIMBH3 PBA profiles of each sample were presented, and The data were normalized to the BCL2-BIMBH3 PBA level of HL60 cell. h, Comparison of the estimated scores of AML samples between responsive (R, n = 4) and non-responsive (NR, n = 10) samples for in vivo ABT-199 administration (Two-sided Mann-Whitney test, p-value = 0.004). Six additional samples from the same cohort collected after relapse (BC-7064-R, BC-7082-R, BC-7107-R2, BC-8900, BC-9458, BC-9492) were included, which were categorized as the NR. The centre line represents the median, the box limits are upper and lower quartiles, and the whiskers represent 1.5x interquartile range for the box plots. Source data
그림 출처: PubMed Central 공개 논문 (PMC11584402)
Conflict of interest statement
Competing interests: C.C., M.C., H.L., B.C., S.H., Y.L., Y.K. and T.-Y.Y. filed a patent on the findings of this work (patent number 10-2020-0157961, South Korea). The other authors declare no competing interests.
그 밖의 정보
출판 형태
Journal Article, Research Support, Non-U.S. Gov't
저널
Nature biomedical engineering · eISSN 2157-846X
전자 출판
2024-07-18
MeSH
Leukemia, Myeloid, Acute* / drug therapy / metabolism · Humans · Bridged Bicyclo Compounds, Heterocyclic* / pharmacology / therapeutic use · Proto-Oncogene Proteins c-bcl-2* / metabolism · Sulfonamides* / pharmacology / therapeutic use · Cell Line, Tumor · Protein Interaction Maps / drug effects · Apoptosis / drug effects · Antineoplastic Agents / pharmacology / therapeutic use
National Research Foundation of Korea (NRF) NRF-2021R1A3B1071354 · National Research Foundation of Korea (NRF) NRF-2018M3A9E2023523 · Korea Health Industry Development Institute (KHIDI) HI14C1277