Molecular Medicine & Biopharmaceutical Sciences, Graduate School of Convergence Science and Technology, and College of Medicine, Seoul National University, Seoul, Republic of Korea.
Biomedical Research Institute, Seoul National University Hospital, 101 DeaHak-ro, JongRo-gu, Seoul, 03080, Republic of Korea. leeunju@snu.ac.kr.
Department of Internal Medicine, Seoul National University College of Medicine, 101 DeaHak-ro, JongRo-gu, Seoul, 03080, Republic of Korea.
Abstract
BACKGROUND Hepatic stellate cells (HSCs) are activated in response to liver injury with TIF1γ-suppression, leading to liver fibrosis. Here, we examined the mechanism how reduction of TIF1γ in HSCs induces damage on hepatocytes and liver fibrosis.
METHOD Lrat:Cas9-ERT2:sgTif1γ mice were treated Tamoxifen (TMX) or wild-type mice were treated Thioacetamide (TAA). HSCs were isolated from mice liver and analyzed role of Tif1γ. HepG2 were treated retinol with/without siRNA for Stimulated by retinoic acid 6 (STRA6) or Retinoic acid receptor(RAR)-antagonist, and LX2 were treated siTIF1γ and/or siSTRA6. TAA treated mice were used for evaluation of siSTRA6 effect in liver fibrosis.
RESULTS When we blocked the Tif1γ in HSCs using Lrat:Cas9-ERT2:sgTif1γ mice, retinol is distributed into hepatocytes. Retinol influx was confirmed using HepG2, and the increased intracellular retinol led to the upregulation of lipogenesis-related-genes and triglyceride. This effect was inhibited by a RAR-antagonist or knock-down of STRA6. In the LX2, TIF1γ-suppression resulted in upregulation of STRA6 and retinol release, which was inhibited by STRA6 knock-down. The role of STRA6-mediated retinol transfer from HSCs to hepatocytes in liver fibrosis was demonstrated by in vivo experiments where blocking of STRA6 reduced fibrosis.
CONCLUSIONS Retinol from HSCs via STRA6 in response to injury with TIF1γ-reduction is taken up by hepatocytes via STRA6, leading to fat-deposition and damage, and liver fibrosis.
Keywords
HepatocytesLipogenesisLiver fibrosisRetinolStimulated by retinoic acid 6 (STRA6)
Figures
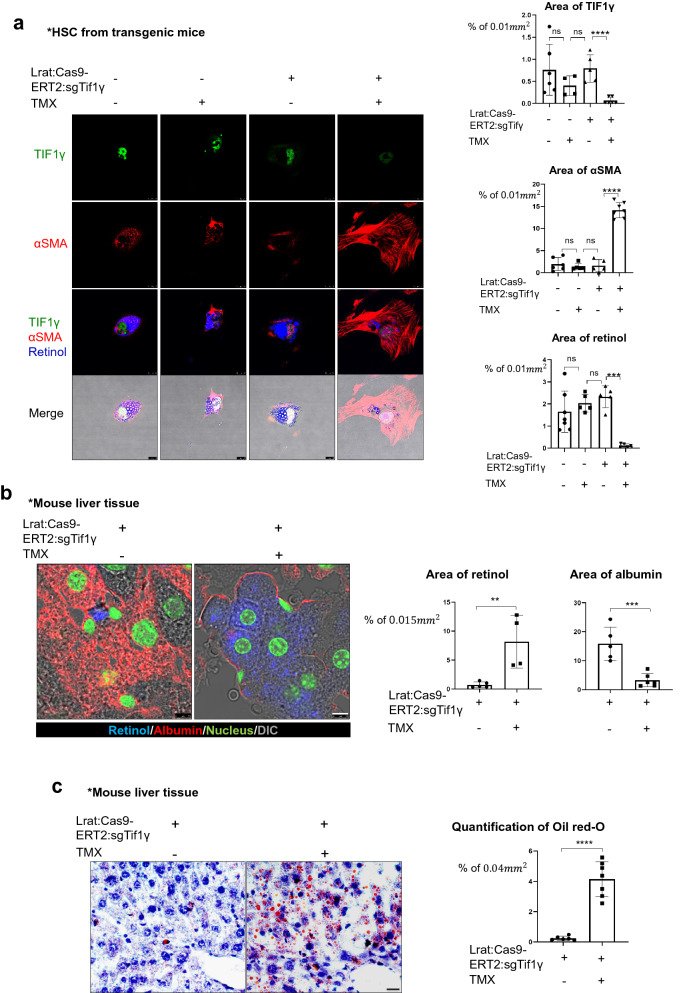
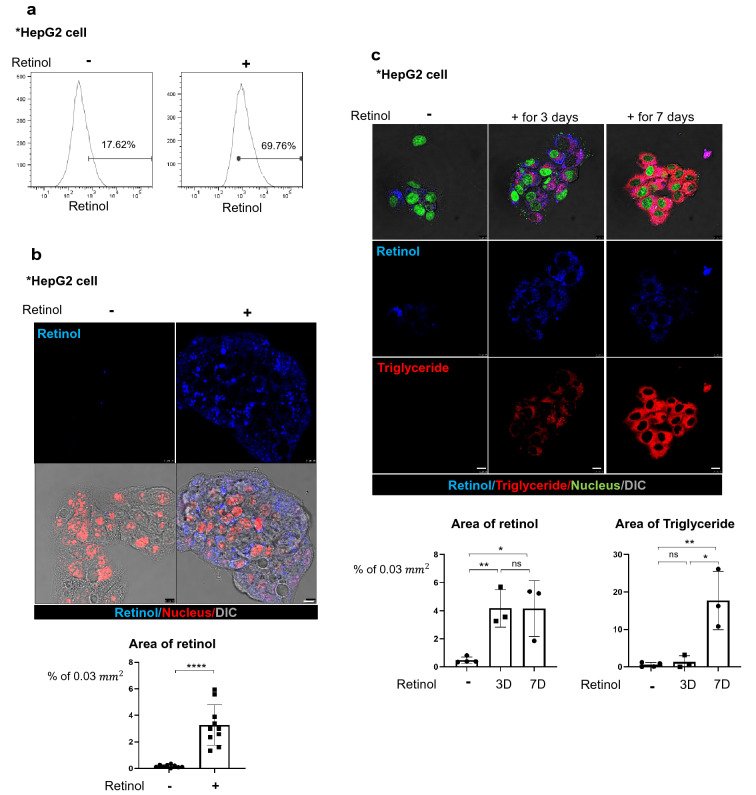
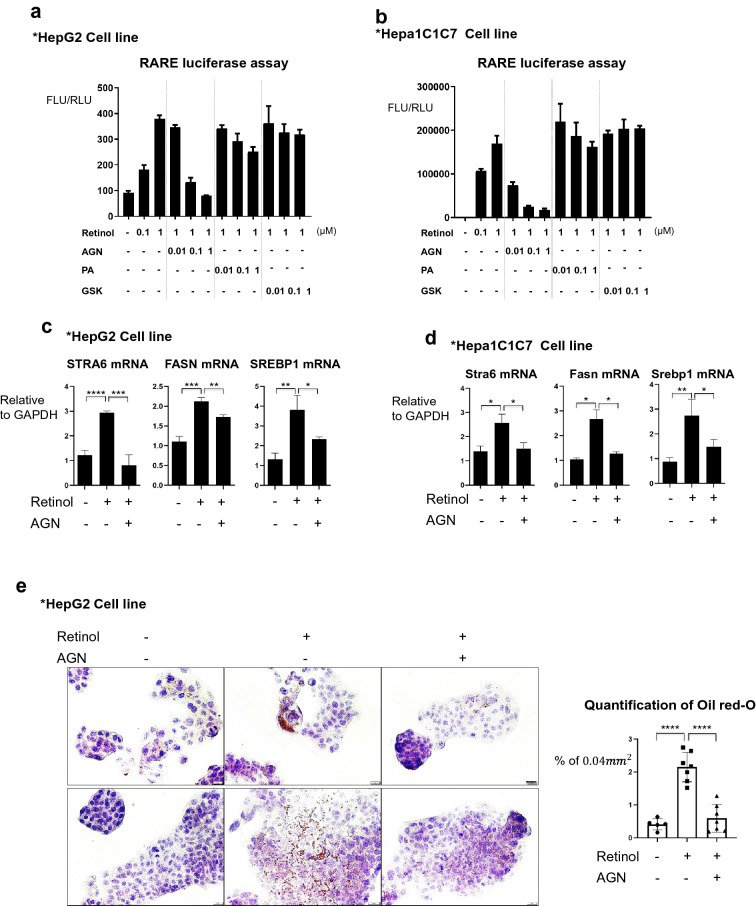
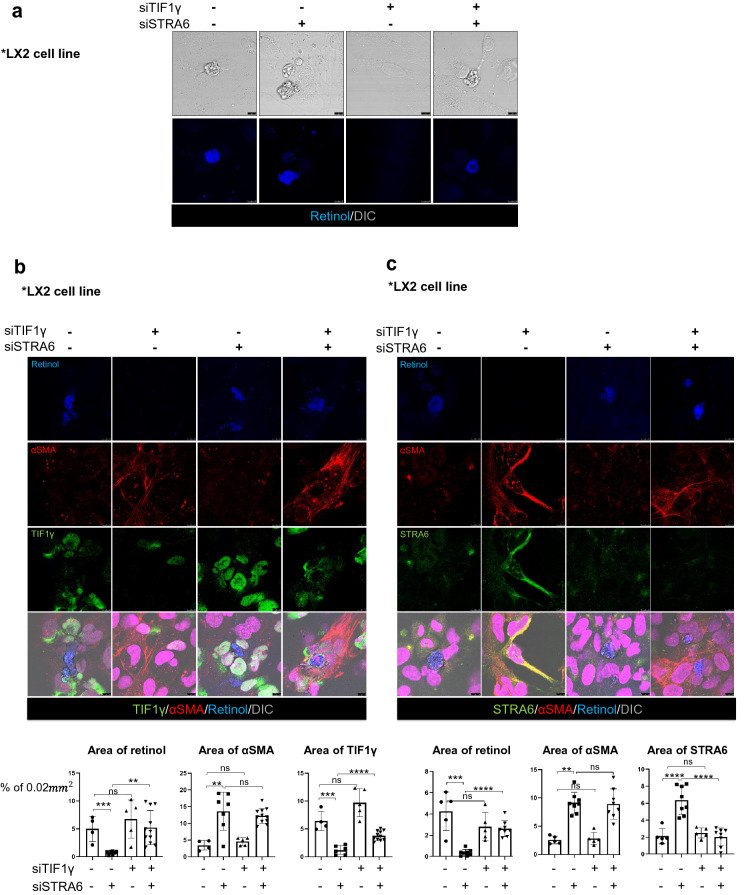
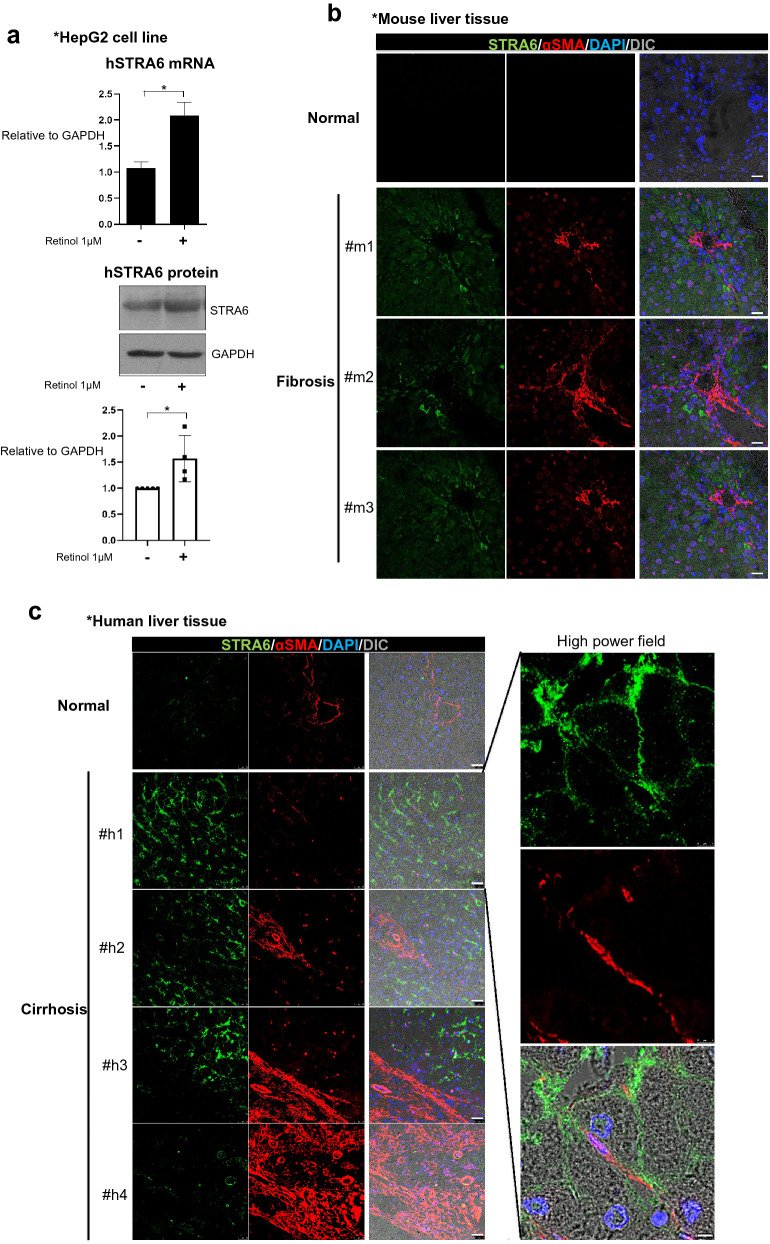
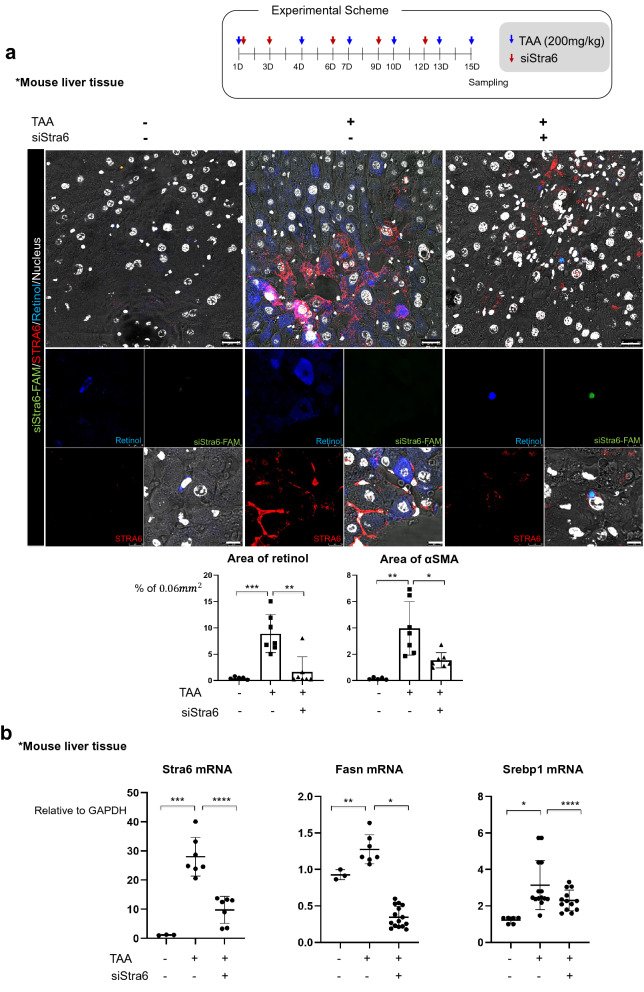
Fig. 1The fibrotic liver undergoes a loss of retinol from HSCs and an accumulation of triglyceride in hepatocytes. a Detection of retinol, TIF1γ, and αSMA in primary hepatic stellate cells from Lrat:Cas9-ERT2: sgTif1γ mice treated with or without 10 nM TMX in DMSO for 3 days. The control group was treated with DMSO only. TIF1γ is shown in green, αSMA is shown in red, and retinol is shown in blue. TIF1γ or αSMA-positive area % per 0.01 mm2 were quantified in five images each group using Image J program. Reproducible result from two independent experiments was shown. ***P < 0.001, ****P < 0.0001, ns; non-significant. Scale bar: 10 μm. b Detection of retinol (blue) and albumin (red) in the liver tissue of normal and Lrat:Cas9-ERT2: sgTif1γ mice treated with TMX in DMSO. The nucleus was stained with SYTOX green. DMSO only in TG, n = 4; TMX in TG, n = 4, complied from two experiments. Retinol or albumin-positive area % per 0.015 mm2 were quantified using Image J program. **P < 0.01, ***P < 0.001. Scale bar: 5 μm. c Oil red-O staining of triglyceride distribution in the liver of Lrat:Cas9-ERT2: sgTif1γ mice. The nuclei were stained with hematoxylin. DMSO only in TG, n = 4; TMX in TG, n = 4, complied from two experiments. Oil-red-O-positive area % per 0.04 mm2 were quantified using Image J program. ****P < 0.0001. Scale bar: 2 μm. d Detection of retinol, TIF1γ, and αSMA in primary hepatic stellate cells from normal mice treated with or without siTif1γ. TIF1γ is shown in green, αSMA is shown in red, and retinol is shown in blue. TIF1γ or αSMA-positive area % per 0.01 mm2 were quantified using Image J program. Reproducible result from two independent experiments was shown. *P < 0.05, ***P < 0.001, Scale bar: 10 μm. e Detection of retinol (blue) and albumin (red) in the liver tissue of normal and treated with TAA (n = 4 each group, two experiments). The nucleus was stained with SYTOX green. Retinol or albumin-positive area % per 0.015 mm2 were quantified using Image J program. **P < 0.01, Scale bar: 5 μm. f Oil red-O staining of triglyceride distribution in the normal and TAA-induced mouse liver (n = 4 each group, two experiments). Scale bar: 2 μmFig. 2Retinol promotes the production of triglyceride in hepatocytes by increasing the expression levels of lipogenesis-related genes in vitro and in vivo. a Flow cytometric analysis using the autofluorescence of retinol. HepG2 cells were treated with or without 1 μm retinol (Ret) for 24 h, and were detected using a 450/50 filter and a 405 nm violet laser. HepG2 treated only with DMSO was used as the negative group, and retinol positivity was analyzed based on hoechst33258, which includes the excitation emission wavelength range of retinol. Reproducible result from two independent experiments was shown. b The accumulation of retinol (Ret; blue) in HepG2 cells treated with or without 1 μm retinol for 24 h. The nuclei were stained with SYTOX orange (red). Retinol-positive area % per 0.03 mm2 were quantified using Image J program. ****P < 0.0001 Scale bar: 10 μm. DIC, differential interference contrast showing the bright phase image of the samples. Reproducible result from three independent experiments was shown. c The distributions of retinol (Ret; blue) and triglyceride (red) in HepG2 cells treated with or without 1 μM retinol for 3 or 7 days. The retinol and its culture media were treated freshly every day because retinol is degraded easily.The nuclei were stained with SYTOX green. Retinol or triglyceride-positive area % per 0.03 mm2 were quantified using Image J program. Reproducible result from three independent experiments was shown. *P < 0.05, **P < 0.01, ns; non-significant. Scale bar: 10 μm. D. The expression levels of lipogenesis-related genes in HepG2 cells treated with or without 1 μm retinol in DMSO as negative control. hSREBP1: sterol regulatory element-binding transcription factor 1; hFASN: fatty acid synthase; hSCD: stearoyl-CoA desaturase-1; hACC: acetyl CoA carboxylase; hACL: ATP citrate lyase; hELOVL: ELOVL fatty acid elongase 6. Reproducible result from three independent experiments was shown. **P < 0.01, ***P < 0.001. e The expression levels of lipogenesis-related genes in the livers of Lrat:Cas9-ERT2: sgTif1γ mice treated with or without TMX (Lrat:Cas9-ERT2: sgTif1γ/Control n = 2, Lrat:Cas9-ERT2: sgTif1γ/TMX n = 3). The experiments were performed in triplicate. Unpaired Student’s t-tests were performed in Prism8. *P < 0.05, **P < 0.01, ***P < 0.001, ****P < 0.0001. F. The expression levels of premature and cleaved SREBP1 in the livers of Lrat:Cas9-ERT2: sgTif1γ mice treated with or without TMX(each line represented independent mouse). The expression level of GAPDH was used as a loading control. *P < 0.05, ns; non-significantFig. 3The RAR mediates increases in the expression levels of lipogenesis-related genes in response to retinol. a Luciferase activity of the pGL3-RARE construct in transfected HepG2 cells. The cells were treated with or without the indicated concentrations of retinol, the RAR antagonist AGN193109 (AGN), the RXR antagonist PA452 (PA), and the LXR blocker GSK2033 (GSK) in DMSO as its vehicle for 24 h. FLU: Firefly Luciferase Unit; RLU: Renilla Luciferase Unit. Reproducible result from three independent experiments was shown. b The luciferase activity of the pGL3-RARE construct in Hepa1C1C7 cells. The cells were treated as described for A. Reproducible result from three independent experiments was shown. C. The expression levels of the mRNAs encoding human STRA6, FASN, and SREBP1 in HepG2 cells treated with or without 1 μM retinol and/or 100 nM AGN in DMSO for 1 day. The experiments were performed in triplicate. Unpaired Student’s t-tests were performed in Prism8. *P < 0.05, **P < 0.01, ***P < 0.001, ****P < 0.0001. D. The expression levels of the mRNAs encoding mouse STRA6, FASN, and SREBP1 in Hepa1C1C7 cells treated with or without 1 μM retinol and/or 100 nM AGN for 1 day. The experiments were performed in triplicate. Unpaired Student’s t-tests were performed in Prism8. **P < 0.01, ***P < 0.001, ****P < 0.0001. e Oil red-O staining showing the accumulation of triglyceride in HepG2 cells treated with or without 1 μM retinol and/or 100 nM AGN for 3 days. Oil-red-O-positive area % per 0.04 mm2 were quantified using Image J program. Reproducible result from two independent experiments was shown. ****P < 0.0001. The nuclei were stained with hematoxylin. Scale bar: 2 μmFig. 4Knock-down of STRA6 inhibits the release of retinol from activated HSCs. a The LX2 cell line was treated with 1 μM retinol for 3 days following transfection with siRNAs targeting human TIF1γ and/or STRA6. The DIC channel (bright image) shows the cell morphology, and retinol autofluorescence is shown in blue. Reproducible result from two independent experiments was shown. Scale bar: 10 μm. b,c The experimental conditions were the same as described for A. Retinol autofluorescence is shown in blue, αSMA is shown in red, and TIF1γ (b) or STRA6 (c) is shown in green. The nuclei were stained with TO-PRO 3 (magenta). Reproducible result from two independent experiments was shown. Retinol or αSMA or TIF1γ-positive area % per 0.02 mm2 were quantified using Image J program. Reproducible result from three independent experiments was shown. **P < 0.01, ***P < 0.001, ****P < 0.0001, ns; non-significant. Scale bar: 10 μmFig. 5The expression of human and mouse STRA6 in vitro and in vivo. a HepG2 cells were treated with 1 μM retinol in DMSO for 1 day, and the expression levels of the human STRA6 mRNA and protein were determined. The expression level of GAPDH was detected as an endogenous control. The experiments were performed in triplicate. The quantification of western blot data was performed using Image J and unpaired Student’s t-tests were performed in Prism8. *P < 0.05.b The distributions of STRA6 and αSMA in normal (n = 3) and TAA-induced fibrotic mouse liver tissues (n = 3). STRA6 is shown in green, and αSMA is shown in red. The nuclei were stained with DAPI (blue). Scale bar: 25 μm. c The distributions of STRA6 and αSMA in normal (n = 3) and cirrhotic human liver tissues (n = 4). STRA6 is shown in green, and αSMA is shown in red. The nuclei were stained with DAPI (blue). Four samples in the cirrhosis group were analyzed independently, and representative data are shown in each panel. Scale bar of lower magnification: 25 μm; scale bar of higher magnification: 5 μm.d The accumulation of triglyceride in HepG2 cells treated with or without 1 μM retinol in DMSO for 24 h following transfection with a siRNA targeting human STRA6. Retinol autofluorescence is shown in blue, and triglyceride was stained using BODIPY (red). Retinol or triglyceride-positive area % per 0.03 mm2 were quantified five images using Image J program. Reproducible result from three independent experiments was shown. *P < 0.05, **P < 0.01, ***P < 0.001. Scale bar: 10 μm. e The expression levels of the mRNAs encoding human STRA6, FASN, and SREBP1 in HepG2 cells transfected with or without a siRNA targeting STRA6, and treated with or without retinol as described ina. The experiments were performed in triplicate. Unpaired Student’s t-tests were performed in Prism8. **P < 0.01, ***P < 0.001Fig. 6Knock-down of Stra6 attenuates liver fibrosis in vivo. a Delivery of a FAM-tagged siRNA targeting Stra6 to the normal or TAA-treated mouse liver using a vitamin A-liposome complex. The FAM-tagged siRNA targeting Stra6 is shown in green, STRA6 is shown in red, retinol is shown in blue, and the nuclei are shown in white. VitaminA-liposome complex only-treated group: n = 3; vitaminA-liposome complex and TAA-treated group: n = 3; TAA/siStra6 group: n = 5. The experiments were performed three times independently. Retinol or αSMA-positive area % per 0.06 mm2 were quantified using Image J program in five pictures for each group. Scale bar of lower magnification: 25 μm; scale bar of higher magnification: 5 μm. b The effects of siRNA-mediated knock-down of Stra6 on the expression levels of the mRNAs encoding STRA6, FASN, and SREBP1 in normal and TAA-treated mouse liver tissues. VitaminA-liposome complex only-treated group: n = 3; vitaminA-liposome complex and TAA-treated group: n = 3; TAA/siStra6 group: n = 5. The experiments were performed three times independently. P-values were determined using unpaired Student’s t-tests in Prism8. *P < 0.05, **P < 0.01, ***P < 0.001, ****P < 0.0001.c Oil red-O staining showed the accumulation of triglyceride in TAA- and siStra6-treated mouse liver samples. VitaminA-liposome complex only-treated group: n = 3; vitaminA-liposome complex and TAA-treated group: n = 3; TAA/siStra6 group: n = 5. The experiments were performed three times independently. Scale bar of the upper panel: 5 μm; scale bar of the lower panel: 2 μm. d Quantification of the oil red-O staining shown in (c). VitaminA-liposome complex only-treated group: n = 3; vitaminA-liposome complex and TAA-treated group: n = 3; TAA/siStra6 group: n = 5. Five pictures of each sample were analyzed using ImageJ. P-values were determined using unpaired Student’s t-tests in Prism8. ****P < 0.0001. e MT staining of the extracellular matrix and picro-sirius staining of collagen in the VitaminA-liposome complex only-, vitaminA-liposome complex and TAA-treated, and TAA plus siStra6-treated groups. Hematoxylin and eosin (H&E) staining was also performed. Scale bar: 10 μm. f Quantification of the picro-sirius red staining shown in e VitaminA-liposome complex only-treated group: n = 3; vitaminA-liposome complex and TAA-treated group: n = 3; TAA/siStra6 group: n = 5. Four pictures of each sample were analyzed using ImageJ. P-values were calculated using unpaired Student’s t-tests in Prism8. ****P < 0.0001. g, h The levels of aspartate aminotransferase (g) and alanine aminotransferase (h) in mouse serum. Duplicates of each sample were performed. VitaminA-liposome complex only-treated group: n = 3; vitaminA-liposome complex and TAA-treated group: n = 3; TAA/siStra6 group: n = 5. P-values were calculated using unpaired Student’s t-tests in Prism8. **P < 0.01, ****P < 0.0001
그림 출처: PubMed Central 공개 논문 (PMC7789180)
Conflict of interest statement
The authors declare that no competing interests exist.
그 밖의 정보
출판 형태
Journal Article
저널
Cell & bioscience · ISSN 2045-3701
전자 출판
2021-01-06
연구비
Korea Health Industry Development Institute HI14C1277