
Sci Rep. 2021;11(1):11664.
Sex-specific impact of diabetes mellitus on left ventricular systolic function and prognosis in heart failure.
제1저자 곽순구 · 교신저자 박준빈, 조구영
소속 (8)
- Department of Internal Medicine, College of Medicine, Seoul National University, Daehak-ro 101, Jongno-gu, Seoul, 03080, Republic of Korea.
- Cardiovascular Center, Seoul National University Hospital, Seoul, Republic of Korea.
- Department of Cardiology, Cardiovascular Center, Bundang Hospital, Seoul National University, Gumiro 166, Bundang, Seongnam, Gyeonggi-do, Republic of Korea.
- Department of Cardiology in Internal Medicine, Chungnam National University Hospital, Chungnam National University College of Medicine, Daejeon, Republic of Korea.
- Department of Internal Medicine, College of Medicine, Seoul National University, Daehak-ro 101, Jongno-gu, Seoul, 03080, Republic of Korea. nanumy1@gmail.com.
- Cardiovascular Center, Seoul National University Hospital, Seoul, Republic of Korea. nanumy1@gmail.com.
- Department of Internal Medicine, College of Medicine, Seoul National University, Daehak-ro 101, Jongno-gu, Seoul, 03080, Republic of Korea. cardioch@snu.ac.kr.
- Department of Cardiology, Cardiovascular Center, Bundang Hospital, Seoul National University, Gumiro 166, Bundang, Seongnam, Gyeonggi-do, Republic of Korea. cardioch@snu.ac.kr.
Abstract
We aimed to investigate the sex differences in associations of diabetes mellitus (DM) with echocardiographic phenotypes and clinical outcomes of heart failure (HF). We studied 4,180 patients admitted for acute HF between 2009 and 2016 (median follow-up, 31.7 months) whose left ventricular global longitudinal strain (LV-GLS) data were available. Patients were compared by sex and DM. Structural equation model (SEM) analysis was performed to evaluate the moderating effects of two causal paths, via ischemic heart disease (IHD) and LV-GLS, linking DM with mortality. Compared to non-diabetic women, diabetic women had significantly lower LV-GLS (11.3% versus 10.1%, p < 0.001), but the difference was attenuated within men (9.7% versus 9.2%, p = 0.014) (p-for-interaction by sex = 0.018). In Cox analyses, DM was an independent predictor for higher mortality in both sexes (women: adjusted hazard ratio [HR] 1.35, 95% confidence interval [CI] 1.15-1.59 versus men: HR 1.24, 95% CI 1.07-1.44, p-for-interaction by sex = 0.699). Restricted cubic spline curves showed that LV-GLS consistently declined, and mortality increased in women with worsening hyperglycemia, but these trends were not evident in men. In SEM analysis, the main driver from DM to mortality differed by sex; men had a stronger effect via IHD than LV-GLS, whereas LV-GLS was the only predominant path in women.
Figures
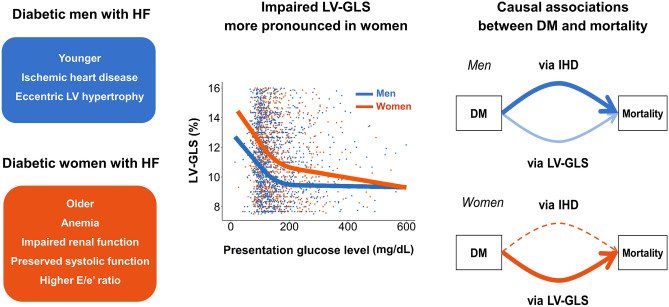
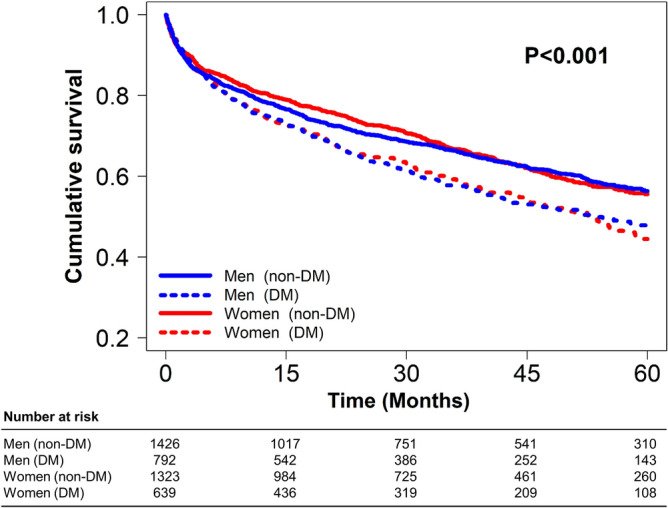
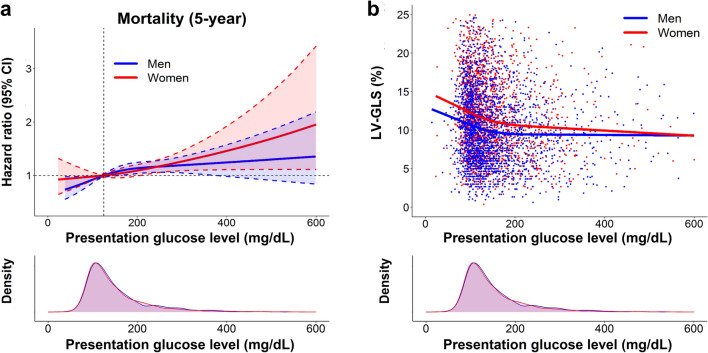
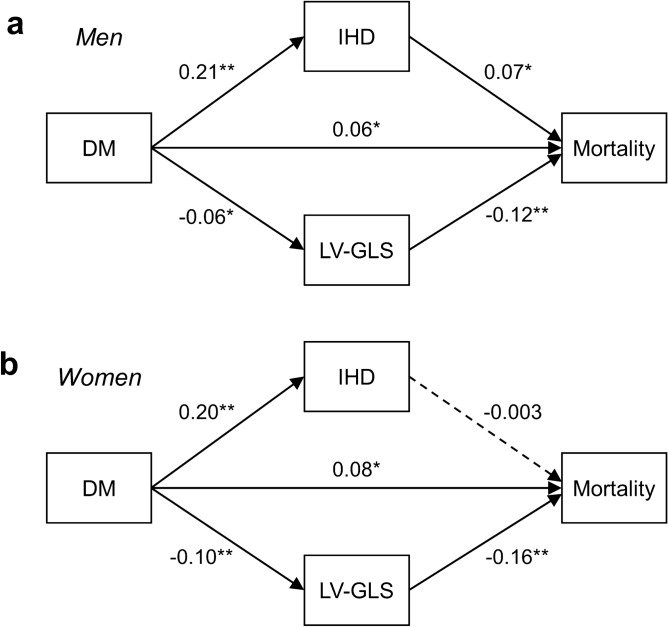
그림 출처: PubMed Central 공개 논문 (PMC8175704)
Conflict of interest statement
The authors declare no competing interests.
그 밖의 정보
- 출판 형태
- Journal Article, Research Support, Non-U.S. Gov't
- 저널
- Scientific reports · eISSN 2045-2322
- 전자 출판
- 2021-06-03
- MeSH
- Aged · Aged, 80 and over · Biomarkers · Blood Glucose · Diabetes Complications / epidemiology · Echocardiography · Female · Heart Failure / diagnosis / epidemiology / etiology / physiopathology · Heart Function Tests · Humans · Kaplan-Meier Estimate · Male · Middle Aged · Mortality · Prognosis · Risk Assessment · Risk Factors · Sex Factors · Ventricular Dysfunction, Left / diagnosis / epidemiology / etiology
- Substances
- Biomarkers · Blood Glucose
- 참고문헌
- 31편