
Sci Rep. 2021;11(1):7007.
Correlation of dynamic membrane fluctuations in red blood cells with diabetes mellitus and cardiovascular risks.
제1저자 손민지 · 교신저자 임수
소속 (4)
- Department of Internal Medicine, Seoul National University Bundang Hospital, Seoul National University College of Medicine, Seongnam, Republic of Korea.
- Department of Physics, Korea Advanced Institute of Science and Technology, Daejeon, Republic of Korea.
- Tomocube Inc., Daejeon, 34051, Republic of Korea.
- Department of Internal Medicine, Seoul National University Bundang Hospital, Seoul National University College of Medicine, Seongnam, Republic of Korea. limsoo@snu.ac.kr.
Abstract
The rheological and physiological properties of red blood cells (RBCs) are affected by many factors in the vascular environment. Among them, membrane fluctuations (MFs), particularly dynamic fluctuations in RBC cell membrane thickness (RBC-MFs), are likely to be altered by the level of glycation of haemoglobin in patients with diabetes mellitus (DM). We investigated the associations of RBC-MFs with physiological variables associated with DM and cardiovascular diseases (CVDs). Forty-one healthy control subjects and 59 patients with DM were enrolled. Five-microliter samples of blood were collected and diluted 400 times. To measure the RBC-MFs, holotomography was used, which non-invasively and precisely analyses the optical characteristics of RBCs. Associations between the RBC-MFs and biochemical parameters related to glucose homeostasis and lipid profiles were investigated. Independent associations of the RBC-MFs with the presence of CVDs were also analysed. RBC-MFs were lower in patients with DM than in healthy participants (61.64 ± 7.49 nm vs 70.65 ± 6.65 nm, P = 1.4 × 10⁻⁸). RBC-MFs correlated modestly with glycated haemoglobin level (ρ = - 0.47) and weakly with age (ρ = - 0.36), duration of diabetes (ρ = - 0.36), fasting plasma glucose level (ρ = - 0.37), and the 10-year Framingham risk score (ρ = - 0.38) (all P < 0.05). Low RBC-MFs were independently associated with the presence of CVDs after adjusting for CVD risk factors. The weak but significant associations of RBC-MFs with cardiometabolic risk factors and CVDs suggest that such deformity of circulating RBCs may be a useful marker of vascular complications of DM.
Figures
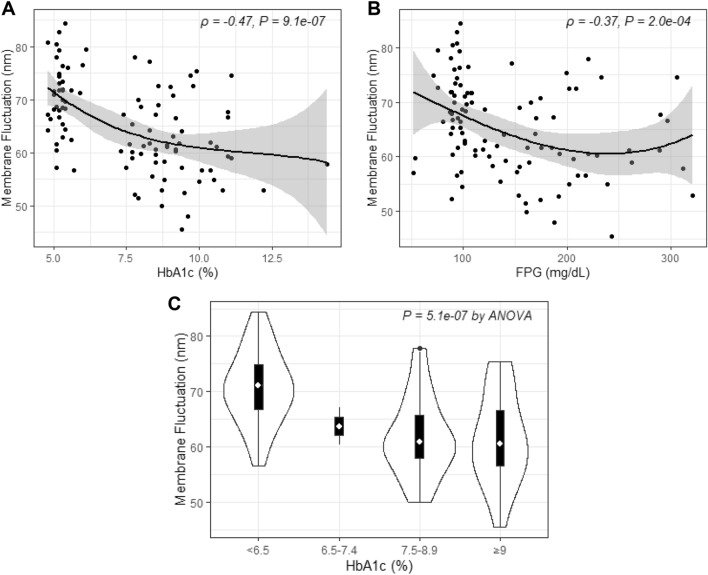
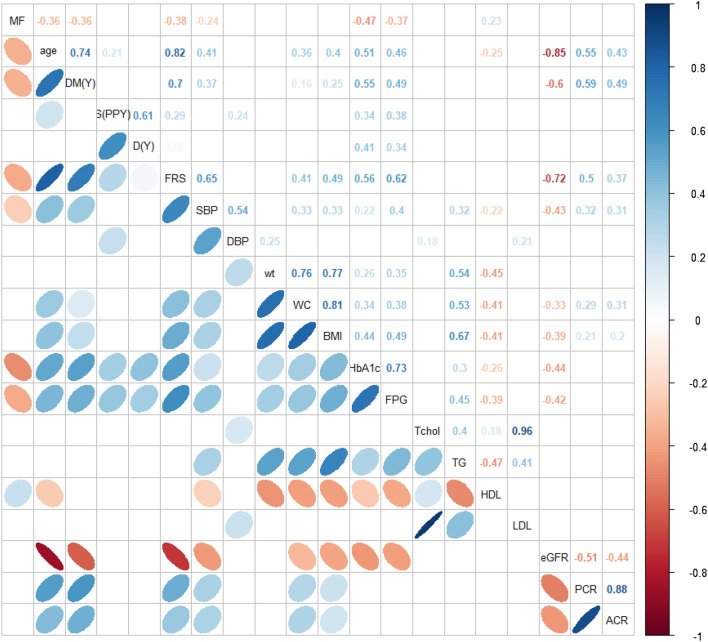
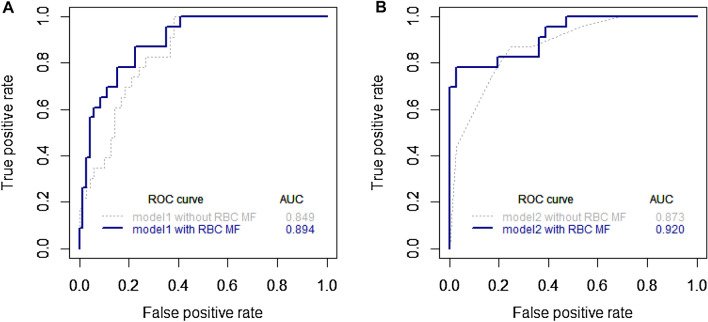
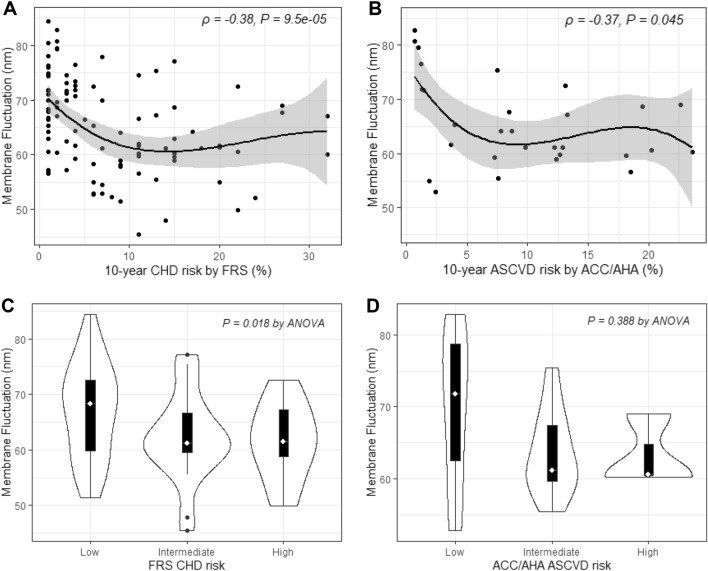
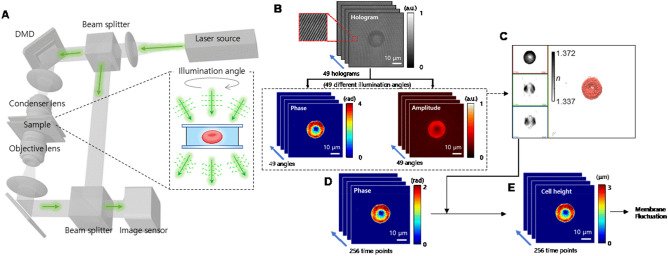
그림 출처: PubMed Central 공개 논문 (PMC7997877)
Comment · 정정
Conflict of interest statement
The authors declare no competing interests.
그 밖의 정보
- 출판 형태
- Journal Article, Research Support, Non-U.S. Gov't
- 저널
- Scientific reports · eISSN 2045-2322
- 전자 출판
- 2021-03-26
- MeSH
- Adult · Aged · Aged, 80 and over · Biomarkers / blood · Blood Glucose / metabolism · Cardiovascular Diseases / pathology · Cell Membrane / physiology · Cross-Sectional Studies · Diabetes Mellitus / pathology · Dyslipidemias / blood / pathology · Erythrocytes / physiology · Female · Glucose / metabolism · Glycated Hemoglobin / analysis · Heart Disease Risk Factors · Humans · Lipid Metabolism / physiology · Lipids / blood · Male · Microscopy, Atomic Force · Middle Aged · Optical Tweezers · Pilot Projects · Young Adult
- Substances
- Biomarkers · Blood Glucose · Glucose · Glycated Hemoglobin · Lipids
- 참고문헌
- 49편