
Sci Rep. 2021;11(1):17240.
Changes in copeptin levels before and 3 months after transsphenoidal surgery according to the presence of postoperative central diabetes insipidus.
제1저자 김유형, 김용휘 · 교신저자 임환섭, 김정희
소속 (7)
- Department of Internal Medicine, Seoul National University Hospital, Seoul National University College of Medicine, Seoul, 03080, Korea.
- Department of Neurosurgery, Seoul National University Hospital, Seoul National University College of Medicine, Daehak-ro, Jongno-gu, Seoul, 10103080, Korea.
- Pituitary Center, Seoul National University Hospital, Seoul, 03080, Korea.
- Seoul Clinical Laboratories, Heungdeok IT Valley 25F, HeungDeok 1-ro 13, Giheung Gu, YongIn City, 16954, Gyeonggido, Korea.
- Seoul Clinical Laboratories, Heungdeok IT Valley 25F, HeungDeok 1-ro 13, Giheung Gu, YongIn City, 16954, Gyeonggido, Korea. jlimhs@scllab.co.kr.
- Department of Internal Medicine, Seoul National University Hospital, Seoul National University College of Medicine, Seoul, 03080, Korea. jhkxingfu@gmail.com.
- Pituitary Center, Seoul National University Hospital, Seoul, 03080, Korea. jhkxingfu@gmail.com.
Abstract
Copeptin levels reflect arginine vasopressin (AVP) release from the hypothalamus. Pituitary surgery often impairs AVP release and results in central diabetes insipidus (CDI). Here, we aimed to investigate how serum copeptin level changes 3 months after pituitary surgery and whether it has a diagnostic value for postoperative permanent CDI. Consecutive patients who underwent endoscopic transsphenoidal surgery at a single tertiary hospital were recruited. Serum copeptin levels were measured preoperatively and 3 months postoperatively. Among 88 patients, transient and permanent CDI occurred in 17 (19.3%) and 23 (26.1%), respectively. Three-month postoperative copeptin levels significantly declined from preoperative levels in permanent CDI group (P < 0.001, percentage difference = - 42.2%) and also in the transient CDI group (P = 0.002, - 27.2%). Three months postoperative copeptin level < 1.9 pmol/L under normal serum sodium levels was the optimal cutoff value for diagnosing permanent CDI with an accuracy of 81.8%, while 3-month postoperative copeptin level ≥ 3.5 pmol/L excluded the CDI with a negative predictive value of 100%. Conclusively, 3 months postoperative copeptin levels significantly decreased from preoperative levels in the transient CDI group as well as the permanent CDI group. Three-month postoperative copeptin levels ≥ 3.5 pmol/L under normal serum sodium levels may be diagnostic for excluding postoperative CDI.
© 2021. The Author(s).
Figures
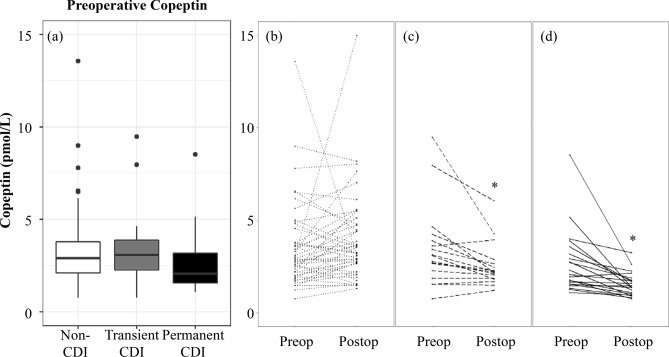
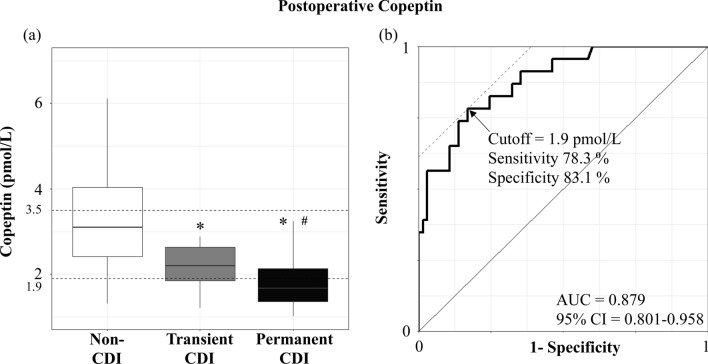
그림 출처: PubMed Central 공개 논문 (PMC8390481)
Conflict of interest statement
The authors declare no competing interests.
그 밖의 정보
- 출판 형태
- Journal Article, Observational Study, Research Support, Non-U.S. Gov't
- 저널
- Scientific reports · eISSN 2045-2322
- 전자 출판
- 2021-08-26
- MeSH
- Adult · Aged · Diabetes Insipidus, Neurogenic / diagnosis / etiology · Female · Glycopeptides / blood · Humans · Male · Middle Aged · Neuroendoscopy / adverse effects / methods · Neurosurgical Procedures / adverse effects / methods · Pituitary Diseases / surgery · Postoperative Complications / diagnosis / etiology · Postoperative Period · Preoperative Period · ROC Curve · Retrospective Studies · Sphenoid Sinus / surgery · Time Factors
- Substances
- Glycopeptides · copeptins
- 참고문헌
- 34편