
Sci Rep. 2021;11(1):17121.
Differential progression of coronary atherosclerosis according to plaque composition: a cluster analysis of PARADIGM registry data.
제1저자 윤연이 · 교신저자 윤연이
소속 (26)
- Department of Radiology, Dalio Institute of Cardiovascular Imaging, New York-Presbyterian Hospital and Weill Cornell Medicine, New York, NY, USA. yeonyeeyoon@gmail.com.
- Department of Internal Medicine, Seoul National University College of Medicine, Cardiovascular Center, Seoul National University Hospital, Seoul, South Korea. yeonyeeyoon@gmail.com.
- Cardiovascular Center, Seoul National University Bundang Hospital, Sungnam, South Korea. yeonyeeyoon@gmail.com.
- Department of Radiology, Dalio Institute of Cardiovascular Imaging, New York-Presbyterian Hospital and Weill Cornell Medicine, New York, NY, USA.
- Department of Cardiovascular Medicine, National Heart Centre, Singapore, Singapore.
- Ipsos US Public Affairs, New York, NY, USA.
- Division of Cardiology, Department of Internal Medicine, Ewha Womans University Seoul Hospital, Ewha Womans University College of Medicine, Seoul, South Korea.
- Yonsei-Cedars-Sinai Integrative Cardiovascular Imaging Research Center, Yonsei University College of Medicine, Yonsei University Health System, Seoul, South Korea.
- Division of Cardiology, Severance Cardiovascular Hospital, Yonsei University College of Medicine, Yonsei University Health System, Seoul, South Korea.
- Centro Cardiologico Monzino, Istituto di Ricovero e Cura a Carattere Scientifico (IRCCS), Milan, Italy.
- Houston Methodist DeBakey Heart and Vascular Center, Houston Methodist Hospital, Houston, TX, USA.
- Department of Medicine, Lundquist Institute at Harbor UCLA Medical Center, Torrance, CA, USA.
- Cardiovascular Imaging Unit, SDN IRCCS, Naples, Italy.
- Department of Cardiology, William Beaumont Hospital, Royal Oak, MI, USA.
- Pusan University Hospital, Busan, South Korea.
- Cardiovascular Center, Seoul National University Bundang Hospital, Sungnam, South Korea.
- Department of Radiology, Casa de Saude São Jose, Rio de Janeiro, Brazil.
- Department of Radiology and Nuclear Medicine, German Heart Centre Munich, Munich, Germany.
- Department of Internal Medicine, Seoul National University College of Medicine, Cardiovascular Center, Seoul National University Hospital, Seoul, South Korea.
- Gangnam Severance Hospital, Yonsei University College of Medicine, Seoul, South Korea.
- Department of Medicine and Radiology, University of British Columbia, Vancouver, BC, Canada.
- Department of Radiology, Area Vasta 1/Azienda Sanitaria Unica Regionale (ASUR) Marche, Urbino, Italy.
- Unit of Cardiovascular Imaging, UNICA, Hospital da Luz, Lisbon, Portugal.
- NOVA Medical School, Lisbon, Portugal.
- Icahn School of Medicine at Mount Sinai, Mount Sinai Heart, Zena and Michael A. Wiener Cardiovascular Institute, and Marie-Josée and Henry R. Kravis Center for Cardiovascular Health, New York, NY, USA.
- Department of Cardiology, Leiden University Medical Centre, Leiden, The Netherlands.
Abstract
Patient-specific phenotyping of coronary atherosclerosis would facilitate personalized risk assessment and preventive treatment. We explored whether unsupervised cluster analysis can categorize patients with coronary atherosclerosis according to their plaque composition, and determined how these differing plaque composition profiles impact plaque progression. Patients with coronary atherosclerotic plaque (n = 947; median age, 62 years; 59% male) were enrolled from a prospective multi-national registry of consecutive patients who underwent serial coronary computed tomography angiography (median inter-scan duration, 3.3 years). K-means clustering applied to the percent volume of each plaque component and identified 4 clusters of patients with distinct plaque composition. Cluster 1 (n = 52), which comprised mainly fibro-fatty plaque with a significant necrotic core (median, 55.7% and 16.0% of the total plaque volume, respectively), showed the least total plaque volume (PV) progression (+ 23.3 mm3), with necrotic core and fibro-fatty PV regression (- 5.7 mm3 and - 5.6 mm3, respectively). Cluster 2 (n = 219), which contained largely fibro-fatty (39.2%) and fibrous plaque (46.8%), showed fibro-fatty PV regression (- 2.4 mm3). Cluster 3 (n = 376), which comprised mostly fibrous (62.7%) and calcified plaque (23.6%), showed increasingly prominent calcified PV progression (+ 21.4 mm3). Cluster 4 (n = 300), which comprised mostly calcified plaque (58.7%), demonstrated the greatest total PV increase (+ 50.7mm3), predominantly increasing in calcified PV (+ 35.9 mm3). Multivariable analysis showed higher risk for plaque progression in Clusters 3 and 4, and higher risk for adverse cardiac events in Clusters 2, 3, and 4 compared to that in Cluster 1. Unsupervised clustering algorithms may uniquely characterize patient phenotypes with varied atherosclerotic plaque profiles, yielding distinct patterns of progressive disease and outcome.
© 2021. The Author(s).
Figures
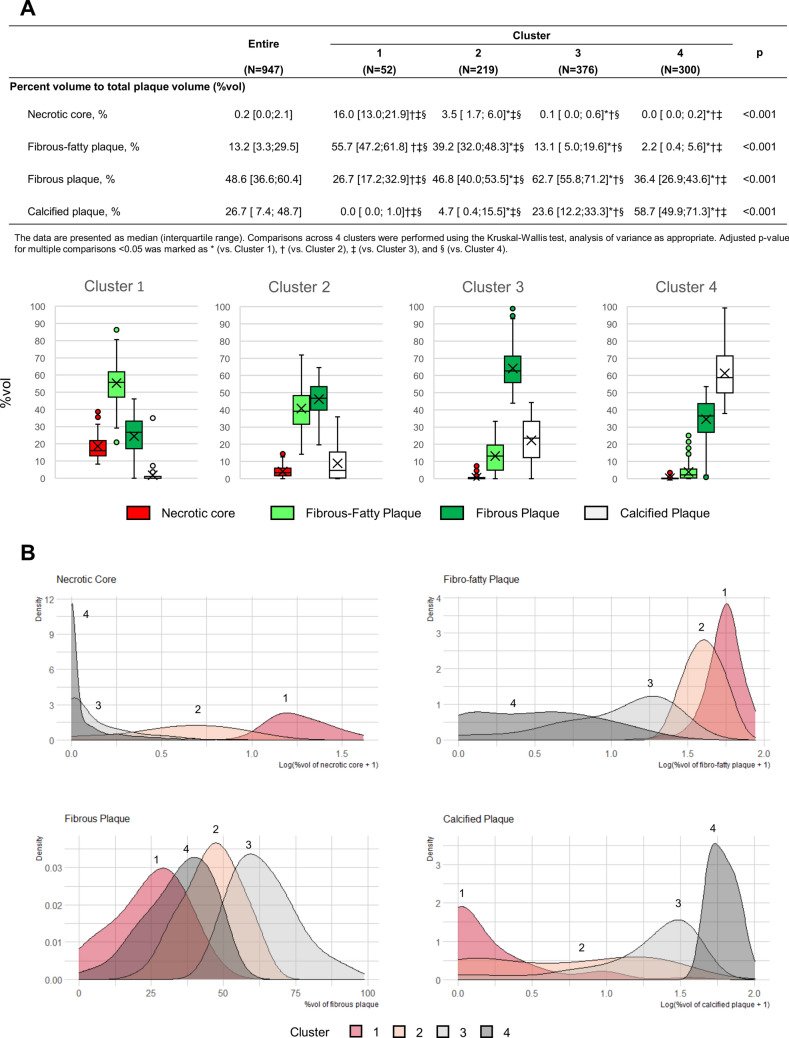
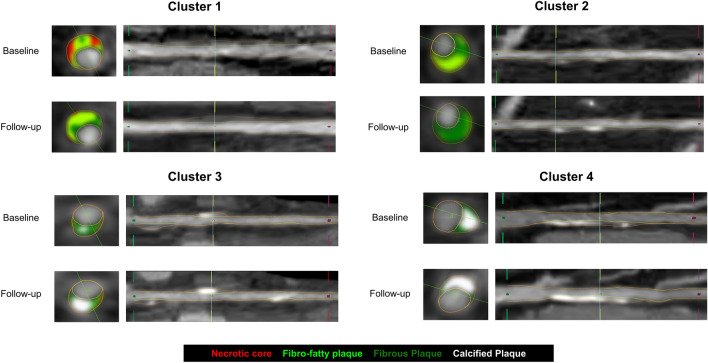
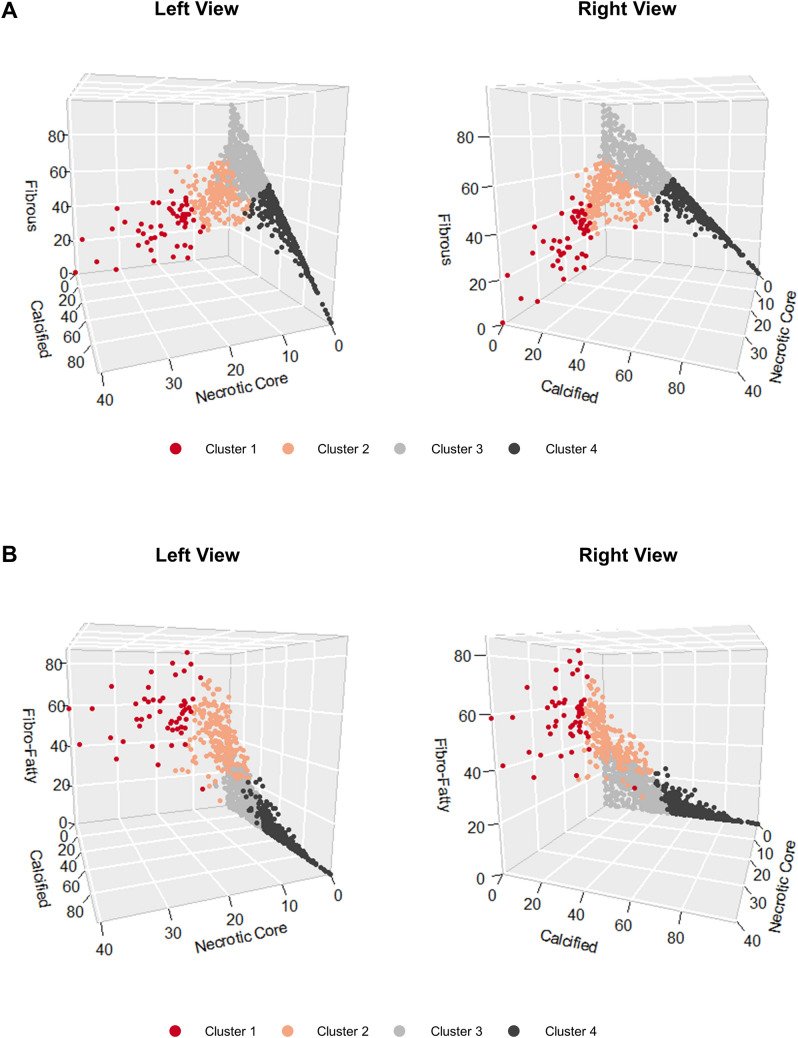
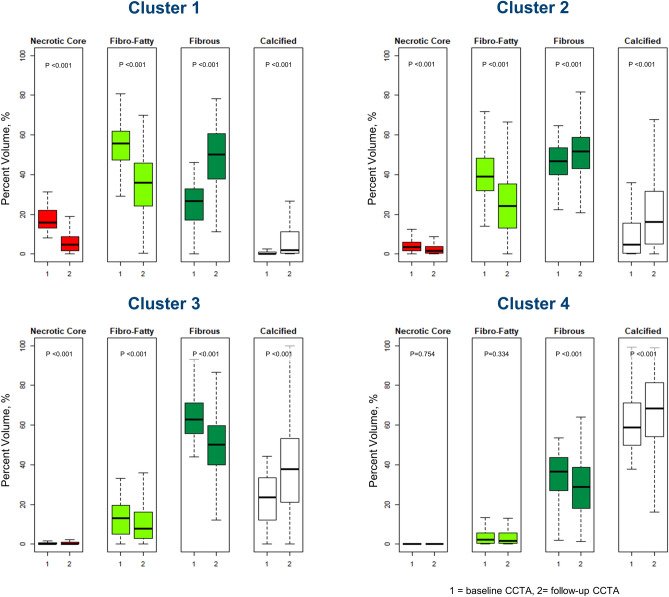
그림 출처: PubMed Central 공개 논문 (PMC8385056)
Conflict of interest statement
Dr. Kavitha Chinnaiyan is a non-compensated medical advisory board member of Heartflow Inc. The remaining authors have nothing to disclose.
그 밖의 정보
- 출판 형태
- Journal Article
- 저널
- Scientific reports · eISSN 2045-2322
- 전자 출판
- 2021-08-24
- MeSH
- Aged · Cluster Analysis · Coronary Angiography · Coronary Artery Disease / diagnostic imaging / pathology · Female · Humans · Male · Middle Aged · Plaque, Atherosclerotic / classification / diagnostic imaging / pathology · Vascular Calcification / diagnostic imaging / pathology
- 참고문헌
- 28편