Department of Physiology, Ajou University School of Medicine, 164 Worldcup-ro, Yeongtong-gu, Suwon, 16499, Republic of Korea.
Department of Biomedical Sciences, Graduate School, Ajou University, 164 Worldcup-ro, Yeongtong-gu, Suwon, 16499, Republic of Korea.
Department of Internal Medicine, Liver Research Institute, Seoul National University College of Medicine, 28 Yongon-dong, Chongno-gu, Seoul, 110-744, Republic of Korea.
Department of Surgery, Seoul National University College of Medicine, 28 Yongon-dong, Chongno-gu, Seoul, 110-744, Republic of Korea.
Department of Internal Medicine, Liver Research Institute, Seoul National University College of Medicine, 28 Yongon-dong, Chongno-gu, Seoul, 110-744, Republic of Korea. yoonjun@snu.ac.kr.
Abstract
Hepatocellular carcinoma harbors numerous genomic and epigenomic aberrations of DNA copy numbers and DNA methylation. Transcriptomic deregulation by these aberrations plays key driver roles in heterogeneous progression of cancers. Here, we profile DNA copy numbers, DNA methylation, and messenger RNA expression levels from 64 cases of hepatocellular carcinoma specimens. We find that the frequencies of the aberrancies of the DNA copy-number-correlated (CNVcor) expression genes and the methylation-correlated expression (METcor) genes are co-regulated significantly. Multi-omics integration of the CNVcor and METcor genes reveal three prognostic subtypes of hepatocellular carcinoma, which can be validated by an independent data. The most aggressive subtype expressing stemness genes has frequent BAP1 mutations, implying its pivotal role in the aggressive tumor progression. In conclusion, our integrative analysis of genomic and epigenomic regulation provides new insights on the multi-layered pathobiology of hepatocellular carcinoma, which might be helpful in developing precision management for hepatocellular carcinoma patients.Hepatocellular carcinoma is known to harbour numerous genomic and epigenomic aberrations, driving transcriptomic deregulation. Here, the authors integrate genomic, epigenomic, and expression data to reveal three prognostic subtypes, providing insight to the pathobiology of hepatocellular carcinoma.
Figures
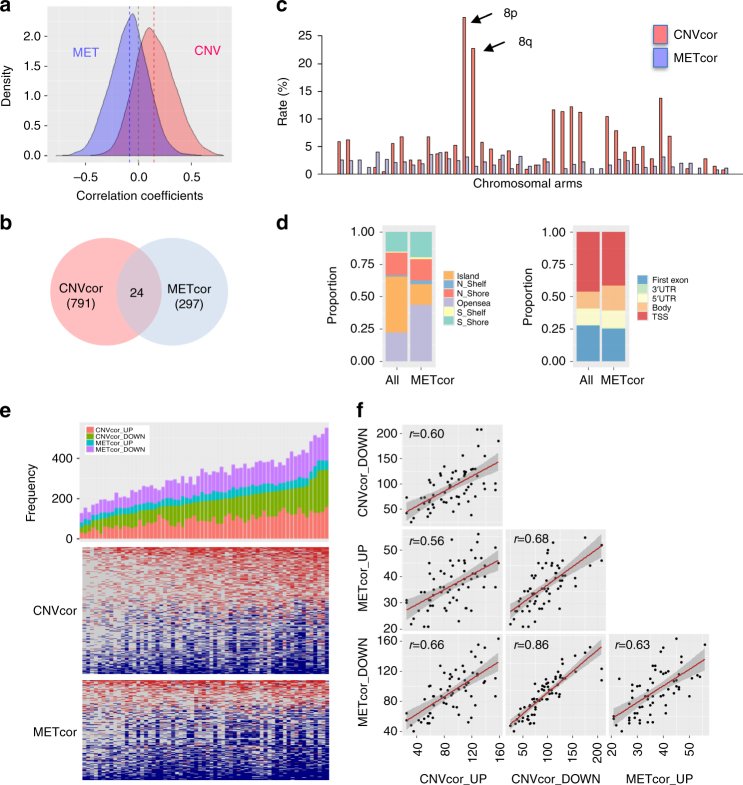
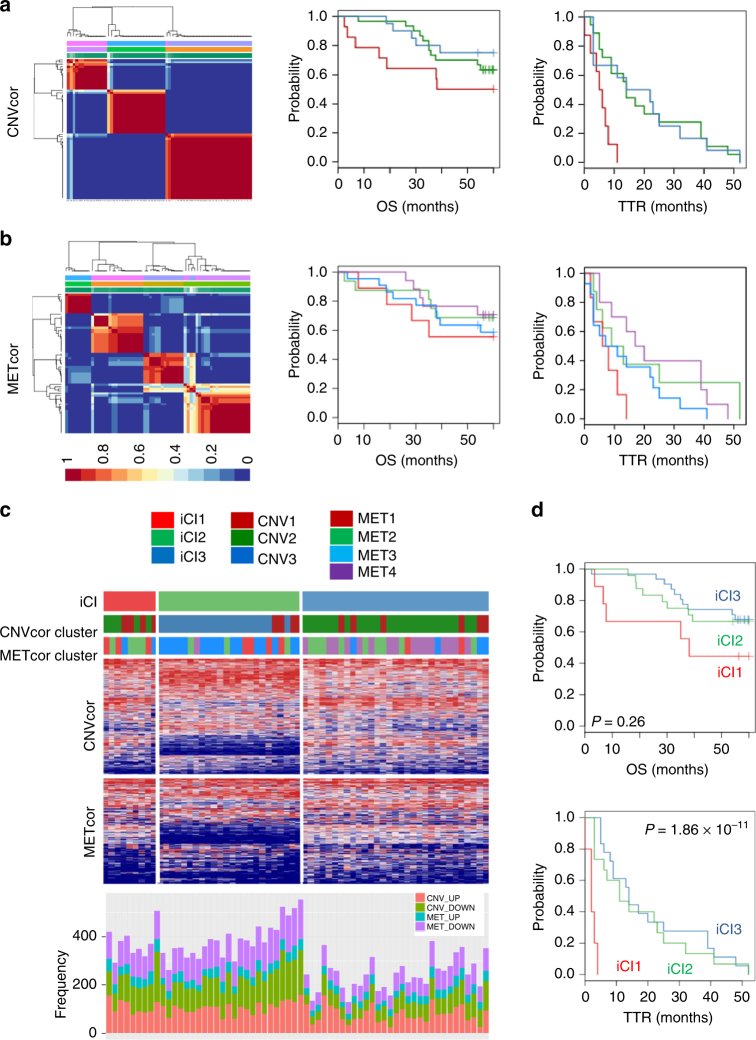
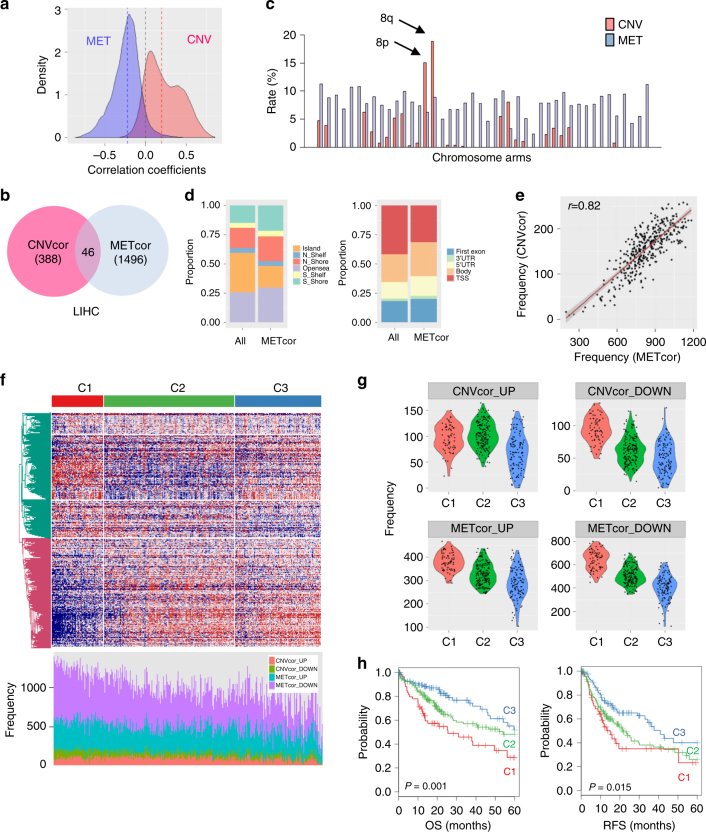
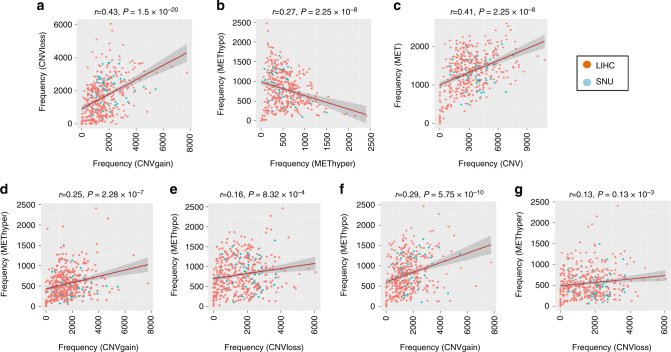
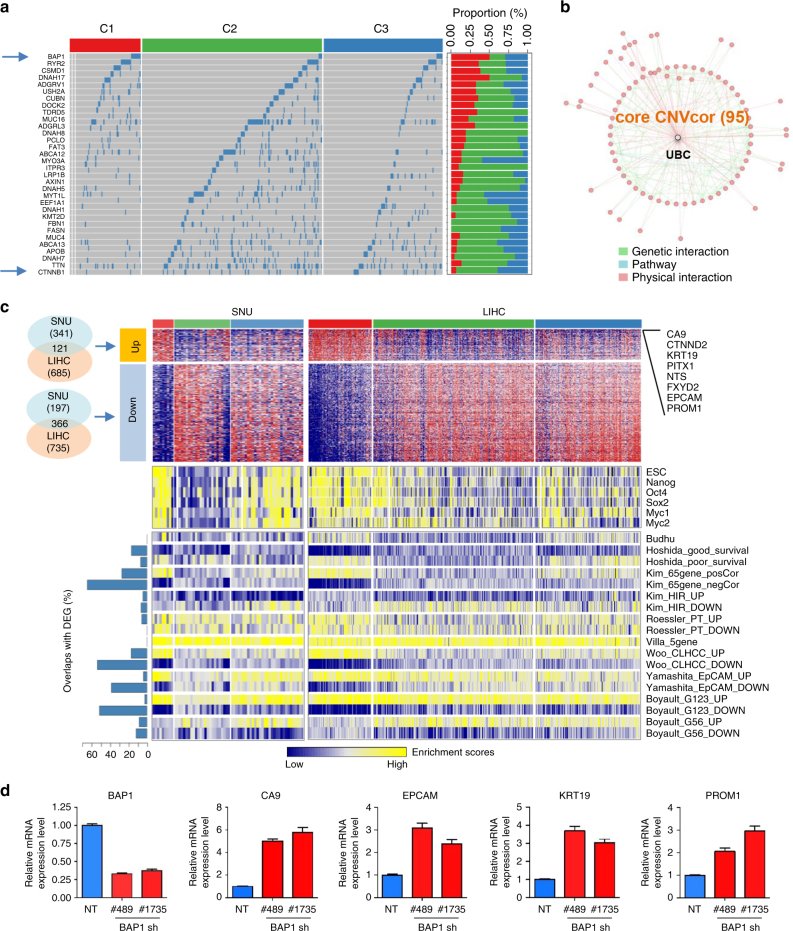
Fig. 1Identification of DNA copy-number-correlated (CNVcor) and DNA methylation-correlated (METcor) genes in HCC. a Distribution of the correlation coefficients between the mRNA expression levels and DNA copy numbers or DNA methylation across the samples are shown, respectively. b A Venn diagram shows the counts of CNVcor and METcor genes. The counts of overlapped genes between CNVcor and METcor are indicated. c Proportional frequencies of the CNVcor or METcor genes against total gene counts in each chromosome arm are shown, respectively. d Genomic positions of DNA methylation probes are categorized based on the positional relations with CpG islands (right) and genes (left), respectively. The proportional frequencies in each category of DNA methylation for the whole genes and METcor genes are compared, respectively. e A barplot shows the frequencies of up- or down-expressed CNVcor genes or METcor genes in each sample (top). Each of CNVcor and METcor genes is categorized as upregulated (CNVcor_UP and METcor_UP) or downregulated (CNVcor_DOWN and METcor_DOWN) genes, respectively. Heatmaps show the up- (red) and down-expressed (blue) CNVcor (middle) and METcor (bottom) genes, respectively. f Dot plots show the pairwise correlations among the frequencies of CNVcor_UP, CNVcor_DOWN, METcor_UP, and METcor_DOWN genes, respectivelyFig. 2Identification of molecular subtypes of HCC using CNVcor and METcor genes. a, b Plots show the non-negative factorization (NMF) cluster results for the CNVcor in CNV data (a) and for the METcor in MET data (b), respectively. Kaplan–Meier plot analyses for subtypes identified by NMF clustering of the CNVcor and METcor genes are shown for overall survival (OS) and time to tumor recurrence (TTR), respectively. c Heatmaps show the expression patterns of subtypes identified by iCluster analysis. The subtypes identified by the CNVcor or METcor genes using NMF cluster methods are indicated with colored bars (top). The frequencies of aberrant expression of CNVcor_UP, CNVcor_DOWN, METcor_UP, and METcor_DOWN genes in each subtype are shown (bottom). d Kaplan–Meier plot analyses for subtypes identified by iCluster (iCl1, iCl2, and iCl3) are shown for overall survival (OS) and time to tumor recurrence (TTR), respectivelyFig. 3Validation of molecular subtypes using an independent TCGA data. a Overall distributions of correlation coefficients of between the mRNA expression levels and DNA copy numbers or DNA methylation are shown, respectively. b A Venn diagram shows the counts of the DNA coy number-correlated genes (CNVcor) and the DNA methylation-correlated genes (METcor) genes. The counts of the overlapped genes between CNVcor and METcor are indicated. c Proportion of the CNVcor or METcor genes against total count of genes in each chromosome arm are shown. d Composition of DNA methylation probes in the whole genes and METcor genes are compared. Genomic positions of DNA methylation probes are categorized based on the relations with CpG island regions (right) and gene regions (left), respectively. e A plot shows the correlation between the frequencies of CNVcor and METcor genes in each sample. f A heatmap shows the expression patterns of the differentially expressed genes among the subtypes identified by iClusterPlus analysis (top). The frequencies of CNVcor_UP, CNVcor_DOWN, METcor_UP, and METcor_DOWN genes are shown (bottom). g Violin plots indicate the frequencies of CNVcor_UP, CNVcor_DOWN, METcor_UP, and METcor_DOWN genes are shown in each subtype of C1, C2, and C3, respectively. h Kaplan–Meier plot analyses of the HCC subtypes for overall survival (OS) and recurrence-free survival (RFS) are shown, respectivelyFig. 4Coordinated aberrations of DNA copy number and DNA methylation in liver cancer. a, b The SNU and LIHC data sets of DNA copy numbers or DNA methylation are integrated by applying “combat” method as described in “Methods.” Aberrations of DNA copy numbers or DNA methylation were determined with cutoff fold difference >0.2 compared to those of the average values of the non-tumoral tissues, respectively. Directional alterations of DNA copy-number gain (CNVgain) and loss (CNVloss) and DNA hypermethylation (METhyper) and hypomethylation (METhypo) in each sample are plotted, respectively. c Overall frequencies of CNV aberration including CNVgain and CNVloss and DNA methylation including METhyper and METhypo are plotted. d–g Plots show the pairwise frequencies of CNVgain, CNVloss, METhyper, and METhypo genes in individual samplesFig. 5Identification of key molecular features for HCC subtypes. a Differentially mutated genes among the subtypes of LIHC are shown. A total of 37 differentially mutated genes are identified, which have differential mutation rates in C1 tumors compared to C2 or C3 tumors, respectively. The two samples of TCGA-G3-A25X-01 and TCGA-BC-4072-01 with no mutation data were excluded in the analysis (indicated with a right grey color). b Network of CNVcor genes is constructed using physical and genetic interactions from GeneMania software, which identifies the highest interconnecting hub gene, UBC. c Heatmaps show the differentially up- (DEG_UP, n = 121) and down-expressed (DEG_DOWN, n = 366) genes that are commonly found in both SNU and LIHC data sets, respectively (top). Top-ranked DEGs are indicated. The DEGs for SNU data are defined with fold difference >1.4 in comparison of iCl1 tumors with iCl2 or iCl3 tumors, while the DEG for LIHC data are defined with fold difference >2 and permuted Student’s t test P < 0.001 in comparison of the C1 tumors compared to C2 or C3 tumors, respectively. Gene set enrichment scores of the embryonic stem cell (ESC)-related gene sets (middle) and the nine molecular classifiers for HCC (bottom) are shown in SNU and LIHC data sets, respectively. Stemness gene sets of ESC, Nanog, Oct4, Sox2, Myc1, and Myc2, and the nine different HCC classifiers are obtained from previous studies as described in “Methods.” d Huh7 cells stably expressing non-targeting (NT) shRNA and BAP1 shRNA (#489 or #1735) were established. Real time qPCR for BAP1 and stemness genes (CA9, KRT19, EPCAM, and PROM1) was performed. The expression values represent means ± S.E.M. of three independent experiments
그림 출처: PubMed Central 공개 논문 (PMC5635060)
Conflict of interest statement
The authors declare no competing financial interests.