Therapeutic single-cell landscape: methotrexate exacerbates interstitial lung disease by compromising the stemness of alveolar epithelial cells under systemic inflammation.
Division of Rheumatology, Department of Internal Medicine, Soonchunhyang University College of Medicine, Cheonan, 31151, South Korea.
Graduate School of Medical Science and Engineering, Korea Advanced Institute of Science and Technology (KAIST), Daejeon, 34141, Republic of Korea.
Samsung Genome Institute, Samsung Medical Center, Sungkyunkwan University School of Medicine, Seoul, 06351, Republic of Korea; Department of Health Sciences and Technology, SAIHST, Sungkyunkwan University, Seoul, 06351, South Korea.
Inocras, Inc., San Diego, CA, 92121, USA; Division of Rheumatology, Department of Internal Medicine, Seoul National University College of Medicine, Seoul, 03080, Republic of Korea.
Division of Rheumatology, Department of Internal Medicine, Seoul National University College of Medicine, Seoul, 03080, Republic of Korea.
Soonchunhyang Institute of Medi-bio Science (SIMS), Soonchunhyang University, Cheonan, 31151, Republic of Korea.
Department of Clinical Pharmacology, College of Medicine, Soonchunhyang University, Cheonan, 31151, Republic of Korea.
Department of Biomedical Science, Seoul National University, Seoul, 03080, Republic of Korea.
Samsung Genome Institute, Samsung Medical Center, Sungkyunkwan University School of Medicine, Seoul, 06351, Republic of Korea.
Division of Rheumatology, Inflammation, and Immunity, Brigham and Women's Hospital and Harvard Medical School, Boston, MA, USA.
Division of Rheumatology, Department of Internal Medicine, Seoul National University College of Medicine, Seoul, 03080, Republic of Korea. Electronic address: elee@snu.ac.kr.
Graduate School of Medical Science and Engineering, Korea Advanced Institute of Science and Technology (KAIST), Daejeon, 34141, Republic of Korea; Inocras, Inc., San Diego, CA, 92121, USA. Electronic address: chemami@kaist.ac.kr.
Abstract
BACKGROUND Interstitial lung disease (ILD) poses a serious threat in patients with rheumatoid arthritis (RA). However, the impact of cornerstone drugs, including methotrexate (MTX) and TNF inhibitor, on RA-associated ILD (RA-ILD) remains controversial.
METHODS Using an SKG mouse model and single-cell transcriptomics, we investigated the effects of MTX and TNF blockade on ILD.
FINDINGS Our study revealed that MTX exacerbates pulmonary inflammation by promoting immune cell infiltration, Th17 activation, and fibrosis. In contrast, TNF inhibitor ameliorates these features and inhibits ILD progression. Analysis of data from a human RA-ILD cohort revealed that patients with ILD progression had persistently higher systemic inflammation than those without progression, particularly among the subgroup undergoing MTX treatment.
INTERPRETATION These findings highlight the need for personalized therapeutic approaches in RA-ILD, given the divergent outcomes of MTX and TNF inhibitor.
FUNDING This work was funded by GENINUS Inc., and the National Research Foundation of Korea, and Seoul National University Hospital.
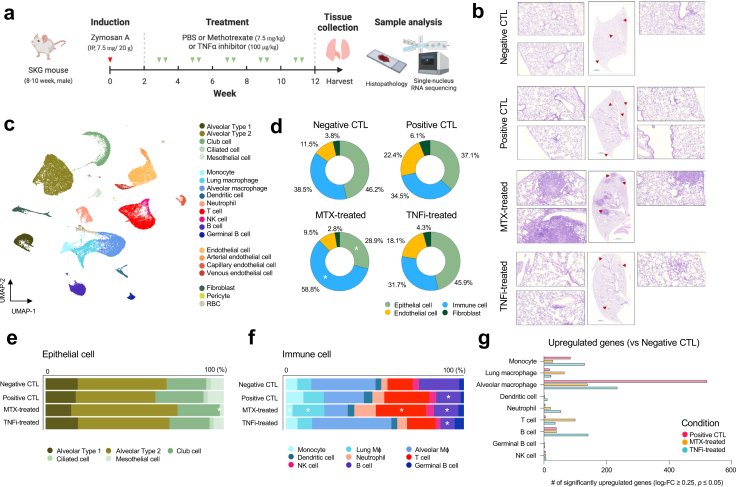
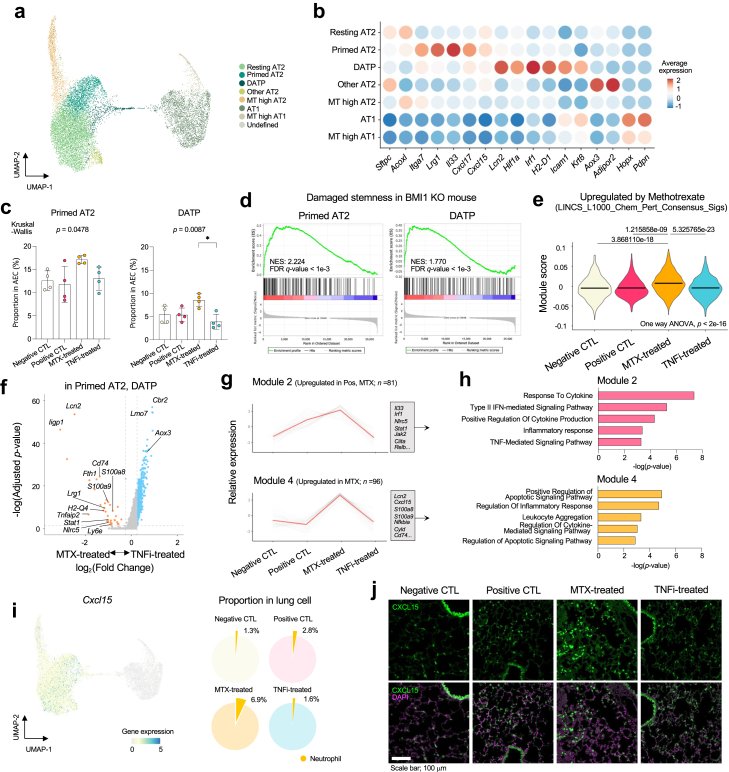
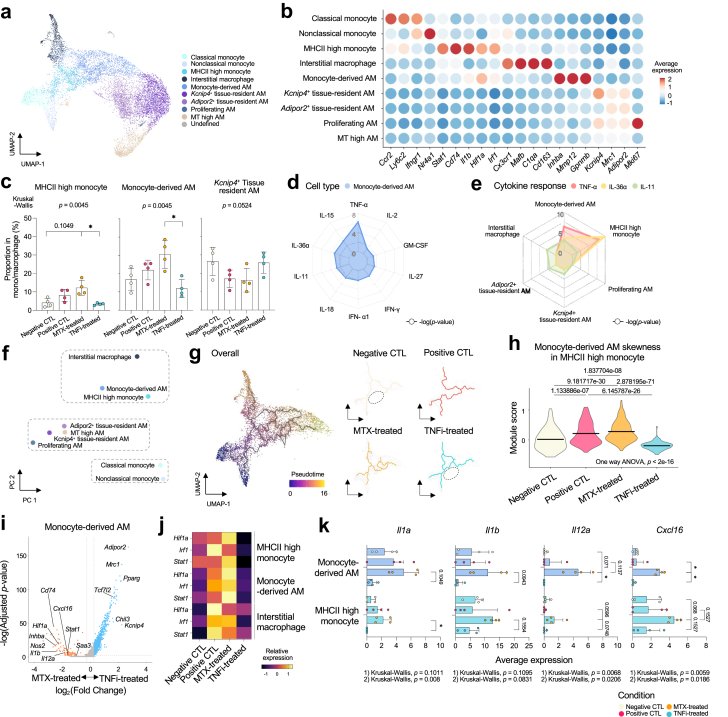
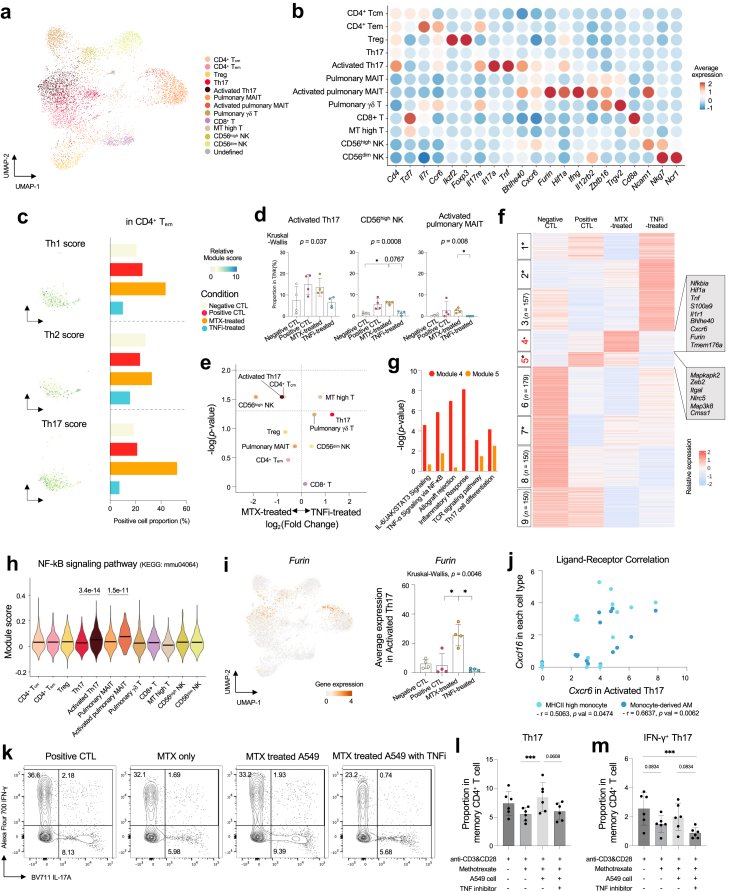
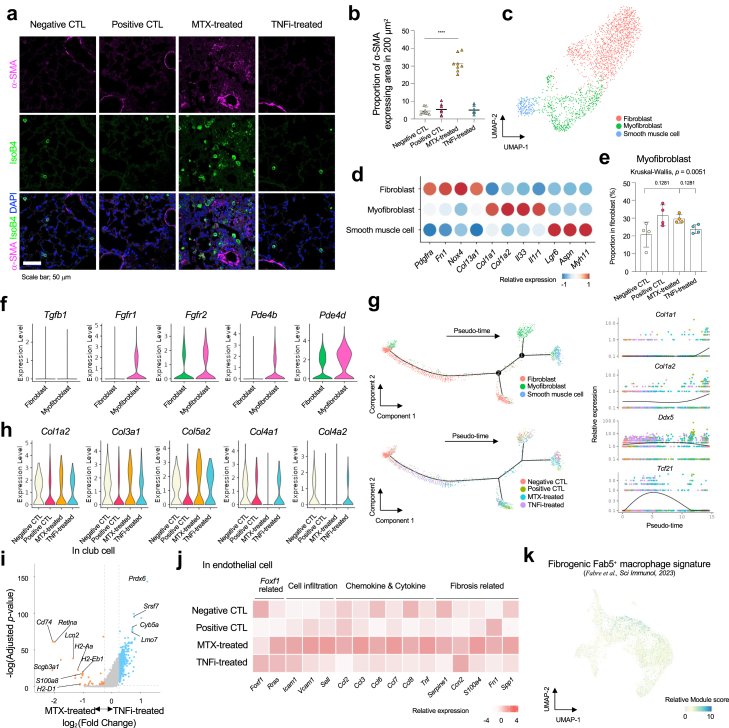
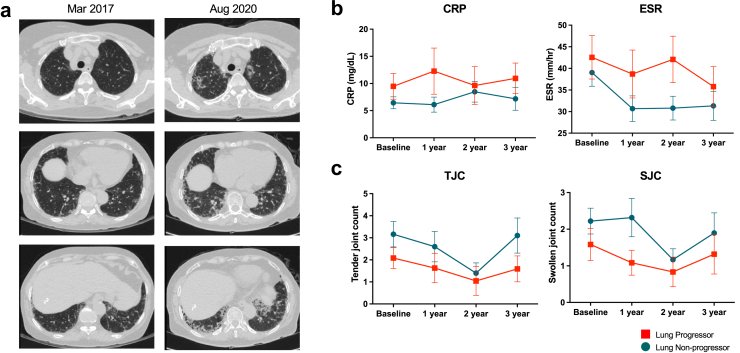
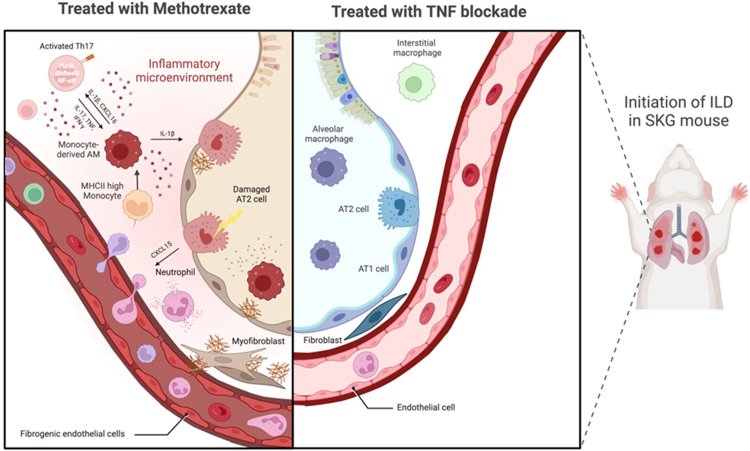
Fig. 1Histopathological changes and inflammatory landscape in SKG lungs. (a) Schematic summary of the experimental design. Negative control (CTL) mice, n = 4; positive CTL mice, n = 4; methotrexate (MTX)-treated mice, n = 4; and TNF inhibitor (TNFi)-treated mice, n = 4. (b) Representative histology with magnified peribronchovascular cell aggregation in the lungs of SKG mice (40X). (c) UMAP projections of the lung cells (n = 59,077) colored according to cell type. (d) Average proportions of each cluster among whole lung cells under different conditions. (e) Proportions of each subcluster among epithelial cells under different conditions. (f) Proportions of each subcluster among immune cells under different conditions. (g) Significantly upregulated genes in immune cell subclusters from positive CTL (red), MTX-treated (orange), and TNFi-treated mice (blue) compared to negative CTL. Statistical analyses were performed using the two-sided Mann–Whitney U test, ∗p < 0.05.Fig. 2Transcriptomic divergence in response to different DMARD treatments in alveolar epithelial cells. (a) UMAP projection of alveolar epithelial cells (AECs) (n = 15,153) colored according to the subclustered cell type. (b) Dot plots of the average normalized expression of marker genes in AECs. (c) Proportions of primed AT2 cells (left) and damage-associated transient progenitors (DATPs) (right) in AECs under different conditions. Data are presented as mean ± standard deviation. (d) Gene Set Enrichment Analysis (GSEA) of significantly down-regulated genes in Bmi1-mutant lung cells for gene sets originating from the top 50 up-regulated genes in primed AT2 cells (left) and DATPs (right). (e) Violin plots of the module score for MTX-specific gene sets in damaged AT2 cells under different conditions. (f) Volcano plot of the differentially expressed genes (DEGs) in damage-associated AT2 cells between MTX-treated and TNFi-treated mice. Each dot indicates an individual gene. (g) Relative expression of genes in Module 2 (above, n = 81) and Module 4 (below, n = 96) under different conditions, clustered by K-means clustering of condition- and cell type-specific DEGs in primed AT2 cells and DATPs. (h) Bar plots of the −log10 (p-value) from enrichment analysis of representative GO biological pathways in Module 2 (above) and Module 4 (below). (i) Normalized expression of Cxcl15 on a UMAP plot of AECs (left) and proportions of neutrophils among whole lung cells under different conditions (right). (j) Immunofluorescent staining of CXCL15 in the lungs of SKG mice in each treatment group. Statistical analyses were performed using the one way ANOVA and Kruskal–Wallis test with Dunn's multiple comparisons, ∗p < 0.05.Fig. 3Effects of MTX and TNF blockade on monocyte-alveolar macrophage differentiation. (a) UMAP projections of monocytes and macrophages (n = 11,342) colored according to subclustered cell type. (b) Dot plots of the average normalized expression of marker genes in mono/macrophages. (c) Bar plots of the proportions of MHCII high monocyte (left), Monocyte-derived alveolar macrophages (AMs) (middle), and Kcnip4+ tissue-resident AMs (right) in mono/macrophages under different conditions. Data are presented as mean ± standard deviation. (d) Radar plot of the −log10 (p value) of the immune response enrichment analysis (IREA) of cytokines in monocyte-derived AMs. (e) Radar plot of the −log10 (p value) of the IREA of TNF-α (red), IL-36α (green), and IL-11 (yellow) in mono/macrophage subsets. (f) Principal component (PC) plot of mono/macrophage subsets. (g) UMAP projections and pseudo-time trajectory initiated from classical and nonclassical monocytes towards monocyte-derived AMs under different conditions. (h) Violin plots of the module score for the monocyte-derived AM marker gene set of MHCII-high monocytes under different conditions. (i) Volcano plot of the differentially expressed genes in monocyte-derived AMs between MTX-treated and TNFi-treated mice. Each dot indicates an individual gene. (j) Heatmap of the relative gene expression of Hif1a, Irf1, and Stat1 in each mono/macrophage subset. (k) Bar plots of the average expression of Il1a, Il1b, Il12a, and Cxcl16 in monocyte-derived AMs (above) and MHCII-high monocytes (below) under different conditions. Data are presented as mean ± standard deviation. Statistical analyses were performed using the one way ANOVA and Kruskal–Wallis test with Dunn's multiple comparisons, ∗p < 0.05.Fig. 4Subpopulation analysis of T cells and natural killer (T/NK) cells. (a) UMAP projections of T/NK cells (n = 6958) colored according to subclustered cell type. (b) Dot plots of the average normalized expression of marker genes in T/NK cells. (c) Expression of the Th1/Th2/Th17 score on a UMAP plot of CD4+ Tem (left) and proportions of CD4+ Tem under different conditions (right). (d) Bar plots of the proportions of activated Th17 cells (left), CD56high NK (middle), and activated pulmonary mucosal-associated invariant T (MAIT) cells (right) among T/NK cells under different conditions. Data are presented as mean ± standard deviation. (e) Volcano plot showing proportional changes among T and NK cells between MTX treated SKG mice (n = 4) and TNFi treated SKG mice (n = 4). (f) Heatmaps of the relative expression of genes clustered by K means clustering of condition- and cell type-specific DEGs in Th17 and activated Th17 cells. (g) Bar plots of the −log10 (p value) from enrichment analysis of representative KEGG and MSigDB Hallmark in Module 4 (red) and Module 5 (orange). (h) Violin plots of the module score for the NF-κB signaling pathway in T/NK subsets under different conditions. (i) Normalized expression of Furin on a UMAP plot of T/NK cells (left) and bar plot of the average expression of Furin in activated Th17 under different conditions (right). Data are presented as mean ± standard deviation. (j) Scatter plot of the Spearman rank correlation between Cxcr6 in activated Th17 cells and Cxcl16 in mono/macrophage subsets. (k) Representative flow cytometry plots for IL-17A+ and IFN-γ+ cells among memory CD4+ T cells of healthy donors with or without A549 cells stimulated by MTX (1 μM). (l) Bar plots showing the proportion of IL-17A+ cells among memory CD4+ T cells of healthy donors (n = 6). (m) Bar plots showing the proportion of IL-17A+ IFN-γ+ cells among memory CD4+ T cells of healthy donors (n = 6). Gating strategy of IL-17A+ IFN-γ+ cells among memory CD4+ T cells is provided in Supplementary Fig. S4. Statistical analyses were performed using the two-sided Mann–Whitney U test and unpaired T test, Kruskal–Wallis test and Friedman test with Dunn's multiple comparisons, ∗p < 0.05, ∗∗∗p < 0.005.Fig. 5Lung fibrosis in SKG mice is aggravated by MTX treatment. (a) Immunofluorescent staining of myofibroblasts and smooth muscle cells (α-SMA, pink) and immune cells (isolectin B4, green) from SKG mice in each treatment group. (b) Dot plots of the proportional area of α-SMA expression under different conditions. (c) UMAP projections of fibroblasts (n = 2197) colored according to subclustered cell type. (d) Dot plots of the average normalized expression of marker genes in fibroblasts. (e) Bar plots of the proportions of myofibroblasts among fibroblasts under different conditions. Data are presented as mean ± standard deviation. (f) Violin plots of the expression of antifibrotic drug target genes in fibroblast subsets. (g) Trajectory and pseudo-time analysis of fibroblasts with pseudo-time gene expression. Colors indicate fibroblast subsets (above) and treatment group (below). (h) Violin plots of the expression of ECM synthesis genes under different conditions. (i) Volcano plot of the differentially expressed genes in club cells between MTX-treated and TNFi-treated mice. Each dot indicates an individual gene. (j) Heatmap of the relative expression of fibrogenic features in endothelial cells. (k) Expression of the Fab5+ macrophage signature on a UMAP plot of mono/macrophage subsets. Statistical analyses were performed using the two-sided Mann–Whitney U test and Kruskal–Wallis test with Dunn's multiple comparisons, ∗p < 0.05, ∗∗∗∗p < 0.001.Fig. 6Concurrent MTX use and elevated inflammation in the RA-ILD cohort. (a) Representative computed tomography (CT) image of representative cases with significant interstitial lung disease (ILD) progression. (b) Plots of the C-reactive protein (CRP, left) concentration and erythrocyte sedimentation rate (ESR, right) between ILD progressors and non-progressors. Whiskers represent minima and maxima. (c) Plots of the tendon joint count (TJC, left) and swollen joint count (SJC, right) between ILD progressors and non-progressors. Whiskers represent minima and maxima.Graphical Abstract
그림 출처: PubMed Central 공개 논문 (PMC11437874)
Conflict of interest statement
Declaration of interests Dr. Sparks has received research support from Bristol Myers Squibb and Boehringer Ingelheim unrelated to this work. He has performed consultancy for AbbVie, Amgen, Boehringer Ingelheim, Bristol Myers Squibb, Gilead, Inova Diagnostics, Janssen, Optum, Pfizer, ReCor, Sobi, and UCB unrelated to this work.