
Kidney Int Rep. 2025;10(7):2296-2310.
Complement Proteins Identify Rapidly Progressive Diabetic Kidney Disease.
제1저자 윤동환 · 교신저자 한승석, Afkarian M
소속 (11)
- Department of Internal Medicine, Seoul National University College of Medicine, Seoul, Korea.
- Department of Biomedical Sciences, Seoul National University College of Medicine, Seoul, Korea.
- Biological Sciences Division, Pacific Northwest National Laboratory, Richland, Washington, USA.
- Division of Nephrology, Department of Medicine, University of California, Davis, California, USA.
- Transdisciplinary Department of Medicine and Advanced Technology, Seoul National University Hospital, Seoul, Korea.
- School of Nursing, University of California, Davis, Sacramento, California, USA.
- Department of Pathology, Seoul National University College of Medicine, Seoul, Korea.
- Department of Pathology, Johns Hopkins University, Maryland, USA.
- Department of Internal Medicine, University of California, Berkeley, Berkeley, California, USA.
- Department of Medicine-Quantitative Health, University of Florida College of Medicine, Gainesville, Forida, USA.
- Department of Internal Medicine, University of California, Davis, California, USA.
Abstract
INTRODUCTION Mechanisms underlying diabetic kidney disease (DKD) progression remain incompletely understood. This study used untargeted and targeted mass spectrometry-based proteomics in 2 independent cohorts to capture rapidly progressive DKD.
METHODS We conducted untargeted and targeted mass spectrometry on urine samples from Korean patients with type 2 diabetes and biopsy-confirmed diabetic nephropathy (SNUH-DN cohort; n = 64) and a DKD subgroup of the Chronic Renal Insufficiency Cohort (CRIC-T2D; n = 282), respectively. Urine proteins associated with kidney disease progression (doubling of serum creatinine, ≥ 50% decrease in estimated glomerular filtration rates [eGFRs], or progression to end-stage kidney disease[ESKD]) were identified after adjusting for eGFR, proteinuria, and other clinical variables.
RESULTS In the SNUH-DN patients, urine proteins clustered into 2 groups, with cluster 1 exhibiting a 4.6-fold higher hazard of disease progression (95% confidence interval [CI]: 1.9-11.5) than cluster 0. Proteins in cluster 1 mapped to 10 pathways, 4 of the top 5 being complement-related. A high complement score, derived from urine complement protein abundance, correlated with histopathologic features of DKD and conferred a 2.4-fold greater hazard of disease progression (95% CI: 1.0-5.4) than a low complement score. In CRIC-T2D, targeted mass spectrometry similarly confirmed that complement score stratified patients into rapid and slow DKD progression groups. In both cohorts, complement score exhibited a linear association with disease progression.
CONCLUSION The strong association between complement activation and rapid DKD progression highlights the need to explore complement inhibition as a potential therapeutic strategy for DKD.
© 2025 International Society of Nephrology. Published by Elsevier Inc.
Keywords
biomarkerscomplement system proteinsdiabetic nephropathiespathologyproteomics
Figures
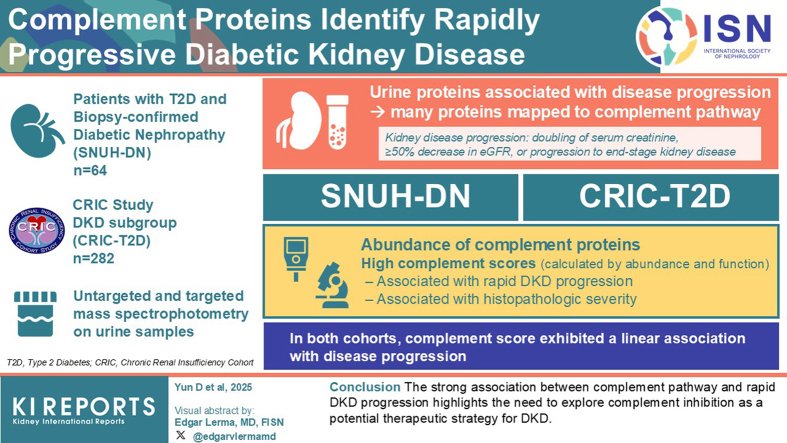
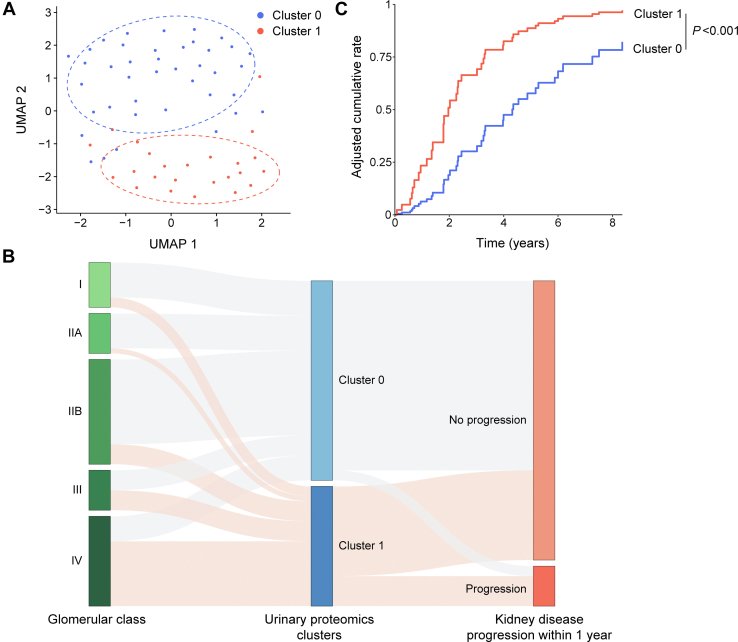
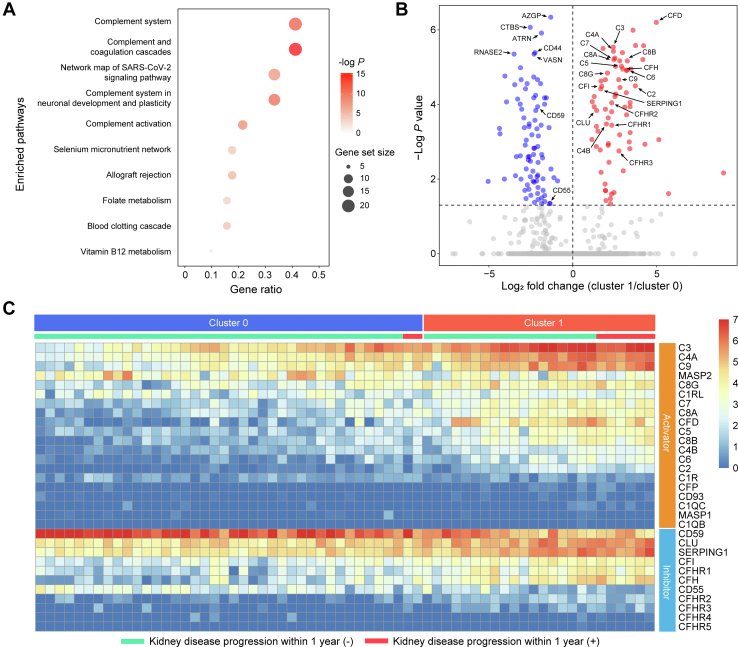
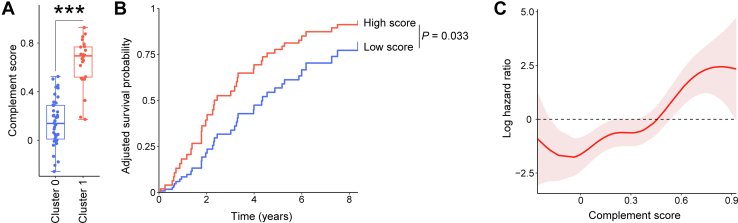
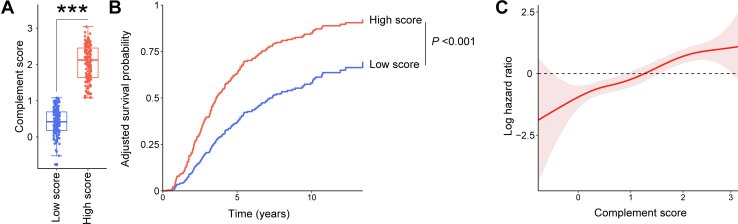
그림 출처: PubMed Central 공개 논문 (PMC12266264)
Comment · 정정
그 밖의 정보
- 출판 형태
- Journal Article
- 저널
- Kidney international reports · eISSN 2468-0249
- 전자 출판
- 2025-05-06
- 참고문헌
- 61편