Department of Internal Medicine, Seoul National University Bundang Hospital, Seongnam, Gyeonggi-do, South Korea.
Department of Internal Medicine, Seoul National University Bundang Hospital, Seongnam, Gyeonggi-do, South Korea. nakim49@snu.ac.kr.
Department of Internal Medicine and Liver Research Institute, Seoul National University College of Medicine, Seoul, South Korea. nakim49@snu.ac.kr.
Laboratory of Immunology, Division of Biotechnology Review and Research-III, Office of Biotechnology Products, Center for Drug Evaluation and Research, Food and Drug Administration, Silver Spring, MD, 20993, USA.
Tumor Microenvironment Global Core Research Center, Seoul National University College of Pharmacy, Seoul, South Korea.
Abstract
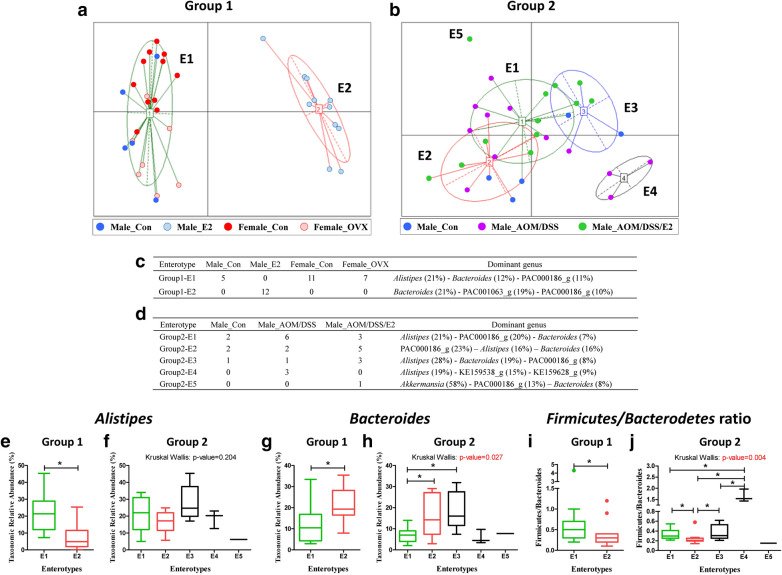
The composition of the gut microbiota is influenced by sex hormones and colorectal cancer (CRC). Previously, we reported that 17β-estradiol (E2) inhibits azoxymethane/dextran sulfate sodium (AOM/DSS)-induced tumorigenesis in male mice. Here, we investigated whether the composition of the gut microbiota is different between male and female, and is regulated by estrogen as a secondary outcome of previous studies. We established four groups of mice based on the sex and estrogen status [ovariectomized (OVX) female and E2-treated male]. Additionally, three groups of males were established by treating them with AOM/DSS, and E2, after subjecting them to AOM/DSS treatment. The mice were sacrificed at 21 weeks old. The composition of the gut microbiota was analyzed using 16S rRNA metagenomics sequencing. We observed a significant increase in the microbial diversity (Chao1 index) in females, males supplemented with E2, and males treated with AOM/DSS/E2 compared with normal males. In normal physiological condition, sex difference and E2 treatment did not affect the ratio of Firmicutes/Bacteroidetes (F/B). However, in AOM/DSS-treated male mice, E2 supplementation showed significantly lower level of the F/B ratio. The ratio of commensal bacteria to opportunistic pathogens was higher in females and E2-treated males compared to normal males and females subjected to OVX. Unexpectedly, this ratio was higher in the AOM/DSS group than that determined in other males and the AOM/DSS/E2 group. Our findings suggest that estrogen alters the gut microbiota in ICR (CrljOri:CD1) mice, particularly AOM/DSS-treated males, by decreasing the F/B ratio and changing Shannon and Simpson index by supply of estrogen. This highlights another possibility that estrogen could cause changes in the gut microbiota, thereby reducing the risk of developing CRC.
Figures
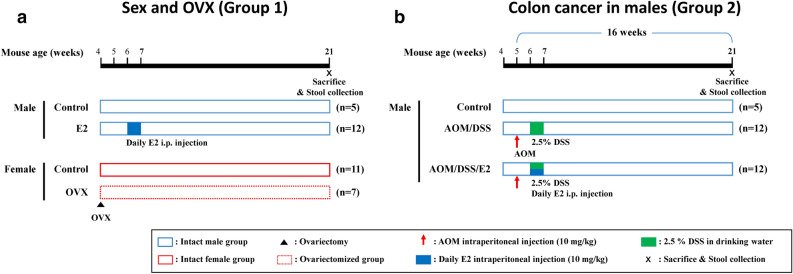
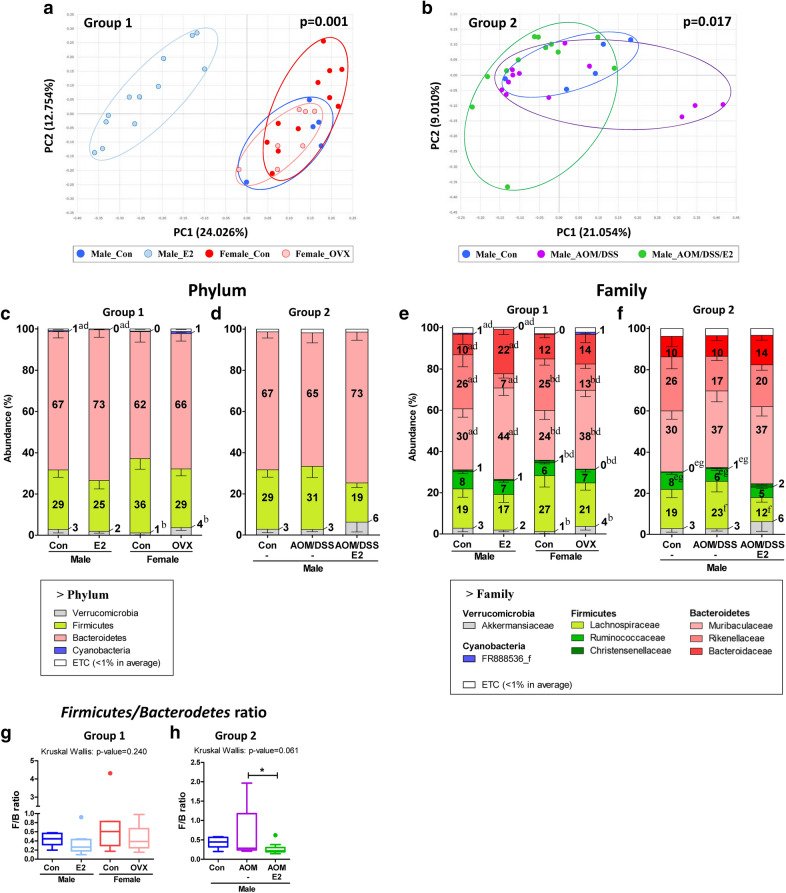
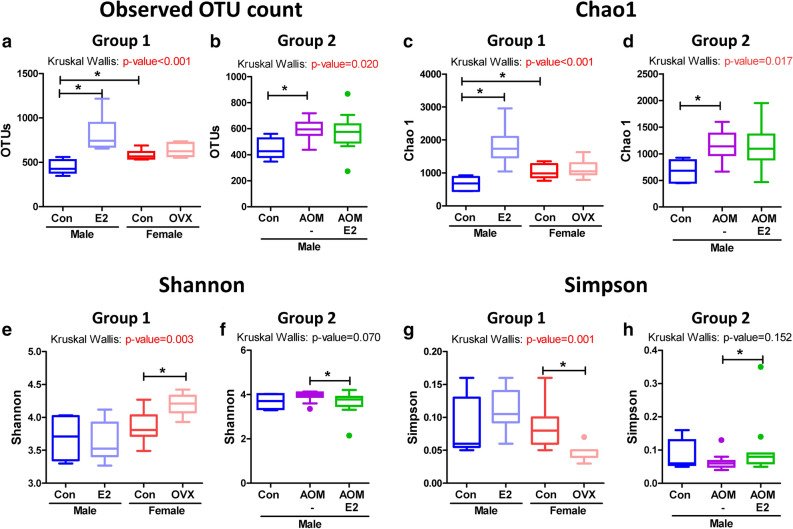
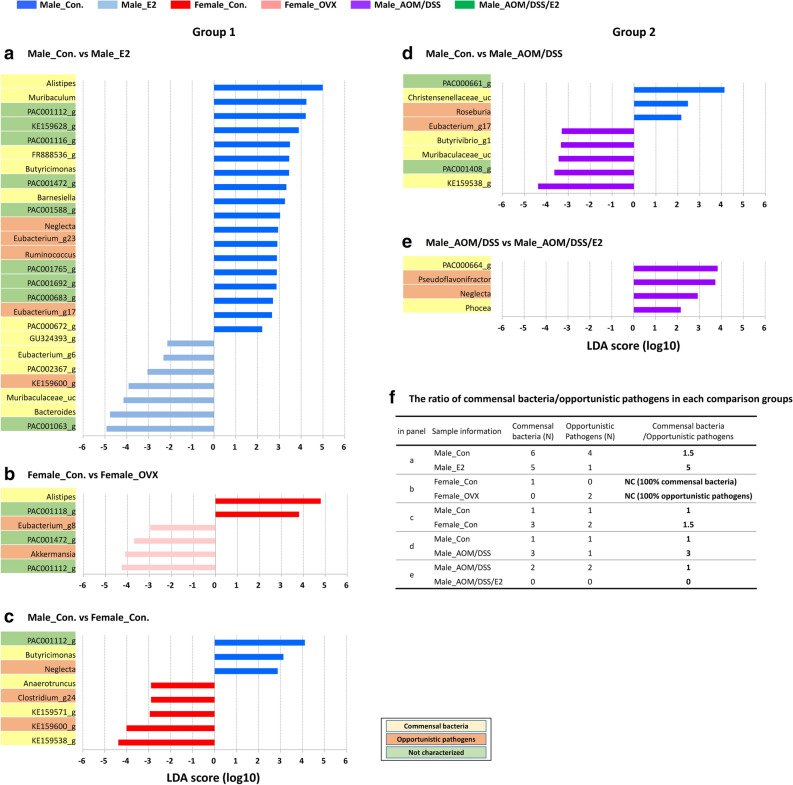
Figure 1Experimental scheme for evaluating the roles of sex and CRC following E2 on gut microbial changes. (a) Group 1 samples: Male_Con, Male_E2, Female_Con, and Female_OVX. Ovariectomy operation was performed at 4 weeks aged female mice. E2 was supplemented by intraperitoneal injection for one week at 6 weeks aged male mice. (b) Group 2 samples: Male_Con, Male_AOM/DSS, and Male_AOM/DSS/E2. At weeks 5, male mice were injected with AOM and were provided DSS in drinking water (2.5%) and E2 supplementation for 1 week at weeks 6. Fecal samples were collected at weeks 21.Figure 2Sample clustering and gut microbiota compositions at the Phylum and Family levels. Metagenome sequencing was performed with 16S rRNA from mouse fecal samples. Clustering of (a) Group 1 and (b) Group 2 mice samples by principal coordinates analysis (PCoA) at the species level. PERMANOVA test for the dissimilarity of bacterial population structures was performed in (a) and (b). Taxonomic composition at the (c, d) phylum and (e, f) family level. Microbial composition of fecal contents from (c, e) Group 1 and (d, f) Group 2. Mann–Whitney U-test for comparison difference between independent two groups was performed in (a), (b), (c), (e), and (f). The difference between Group1 and between Group 2 was analysed by Kruskal–Wallis H test in d and g. (a), p < 0.05 between Male_Con vs. Male_E2; (b), p < 0.05 between Female_Con vs. Female_OVX; (c), p < 0.05 between Male_Con vs. Female_Con; (d), p < 0.05 between Group1; (e), p < 0.05 between Male_Con vs. Male_AOM/DSS; (f), p < 0.05 between Male_AOM/DSS vs. Male_AOM/DSS/E2; (g), p < 0.05 between Group2 (Supplementary Table 1, 2). Firmicutes/Bacteroidetes ratio of (g) Group 1 and (h) Group 2 mice. *, p < 0.05 for comparison between Male_AOM/DSS vs. Male_AOM/DSS/E2. Data are expressed as the mean ± SEM. Whiskers show the minimum and maximum values. Con, control; E2, 17β-Estradiol; OVX, ovariectomized; AOM, azoxymethane; DSS, dextran sulfate sodium salt.Figure 3Alpha diversity of gut microbiota. (a,b) Observed OTU count, (c,d) species richness (Chao1), (e,f) alpha diversity (Shannon), and (g, h) alpha diversity (Simpson) of the gut microbiomes of (a,c,e, g) Group 1 and (b,d,f,h) Group 2 mice. Data are expressed as the mean ± SEM. Whiskers show the minimum and maximum values. p-values to Kruskal–Wallis test is designated on the figure; ∗, p < 0.05 according to Mann–Whitney U-test. Con, control; E2, 17β-Estradiol; OVX, ovariectomized; AOM, azoxymethane; DSS, dextran sulfate sodium salt.Figure 4Alterations in the abundance ratio of the gut microbiota by estrogen on sex and CRC: linear discriminant analysis (LDA) effect size (LEfSe) analysis. Bar plots were generated by following process. (1) an alpha value for the factorial Kruskal–Wallis H test between assigned taxa compared to that of the groups with less than 0.05, (2) an alpha value for the pairwise Wilcoxon test among the taxonomic compositions of less than 0.05, (3) a threshold of the logarithmic LDA score for discriminative features less than 2.0, and (4) a multi-class analysis set as all-against-all. After this primary process, (5) overlapped bacteria selection, (6) search and classify the bacterial characteristics with reference to reported papers: commensal bacteria, opportunistic pathogens, not characterized, and (7) elimination of non-overlapped bacteria only at ‘not characterized’ bacteria. In LEfSe plot, all of commensal bacteria and opportunistic pathogens and only overlapped ‘not characterized’ bacteria are included. Bar plots at the genus level with significant differences in abundance with LEfSe analysis in (a–c) Group 1 (d,e) Group 2 mice. The color bars show the LDA scores of genes that enriched in indicated condition; (a, c, d) blue (male control mice), (a) sky blue (E2-treated male mice), (b, c) red (female control mice), (b) pink (ovariectomized female mice), and (d,e) purple (AOM/DSS-induced CRC). Each color on the genus name indicates the characteristics of each genus: yellow for commensal bacteria, orange for opportunistic pathogens, and green for not characterized bacteria. p-values were determined with the non-parametric factorial Kruskal–Wallis sum-rank test. (f) The ratio of commensal bacteria to opportunistic pathogens based on the LEfSe results in each comparison groups. Con, control; E2, 17β-Estradiol; OVX, ovariectomized; AOM, azoxymethane; DSS, dextran sulfate sodium salt; N, number; NC, not calculated.Figure 5Enterotype clustering. (a) Two enterotypes (Group 1-E1, 2) of sex and OVX samples and (b) five enterotypes (Group 2-E1, 2, 3, 4, 5) of CRC male mice samples. The optimal cluster number was determined by maximizing the Calinski-Harabasz (CH) index value (Supplementary Fig. 4). The tables show the predominant genus in each enterotype of (c) Group 1 and (d) Group 2 mice samples. Relative abundance of (e, f) Alistipes and (g,h) Bacteroides, and (i,j) Firmicutes/Bacterodetes ratio of (e,g,i) Group 1 and (f,h,j) Group 2. Data are expressed as the mean ± SEM. Whiskers show the minimum and maximum values. p-values to Kruskal–Wallis test is designated on the figure; ∗, p < 0.05 according to Mann–Whitney U-test. Con, control; E2, 17β-Estradiol; OVX, ovariectomized; AOM, azoxymethane; DSS, dextran sulfate sodium salt.