Biomedical Research Institute, Seoul National University Bundang Hospital, Seongnam, 13620, Republic of Korea.
Department of Internal Medicine, Seoul National University Bundang Hospital, Seoul National University College of Medicine, 82 Gumi-ro 173 Beon-gil Bundang-gu, Seongnam, 13620, Republic of Korea.
National Cancer Center Graduate School of Cancer Science and Policy, National Cancer Center, Goyang, 10408, Republic of Korea.
Department of Internal Medicine, Seoul National University Bundang Hospital, Seoul National University College of Medicine, 82 Gumi-ro 173 Beon-gil Bundang-gu, Seongnam, 13620, Republic of Korea. imdoctor@snu.ac.kr.
Abstract
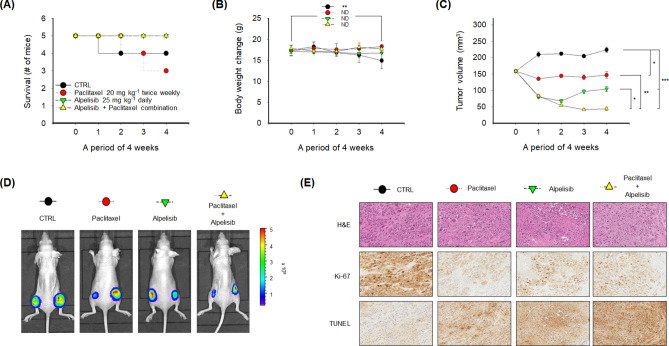
PIK3CA mutations are frequently observed in various human cancers including gastric cancer (GC). This study was conducted to investigate the anti-tumor effects of alpelisib, a PI3K p110α-specific inhibitor, using preclinical models of GC. In addition, the combined effects of alpelisib and paclitaxel on GC were evaluated. Among the SNU1, SNU16, SNU484, SNU601, SNU638, SNU668, AGS, and MKN1 GC cells, three PIK3CA-mutant cells were predominantly sensitive to alpelisib. Alpelisib monotherapy decreased AKT and S6K1 phosphorylation and induced G0/G1 phase arrest regardless of PIK3CA mutational status. The alpelisib and paclitaxel combination demonstrated synergistic anti-proliferative effects, preferentially on PIK3CA-mutant cells, resulting in increased DNA damage response and apoptosis. In addition, alpelisib and paclitaxel combination potentiated anti-migratory activity in PIK3CA-mutant cells. Alpelisib partially reversed epithelial-mesenchymal transition markers in PIK3CA-mutant cells. In a xenograft model of MKN1 cells, the alpelisib and paclitaxel combination significantly enhanced anti-tumor activity by decreasing Ki-67 expression and increasing apoptosis. Moreover, this combination tended to prolong the survival of tumor-bearing mice. Our data suggest promising anti-tumor efficacy of alpelisib alone or in combination with paclitaxel in PIK3CA-mutant GC cells.
Figures
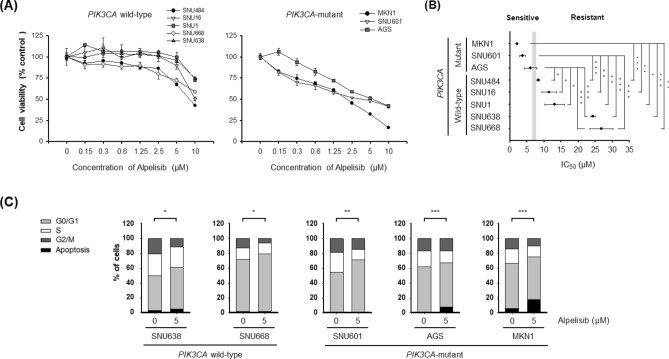
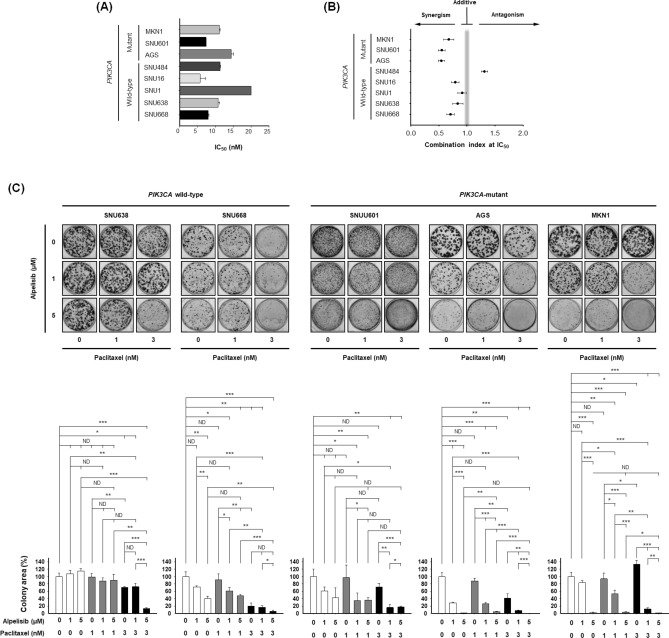
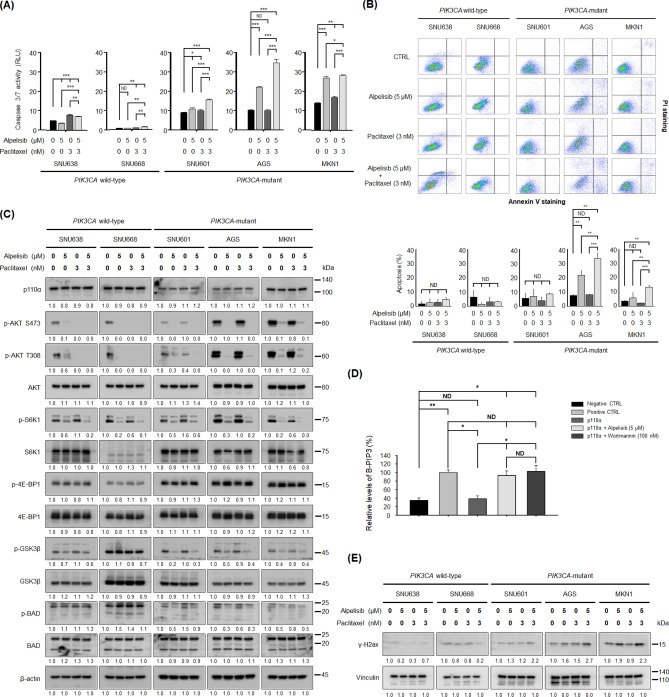
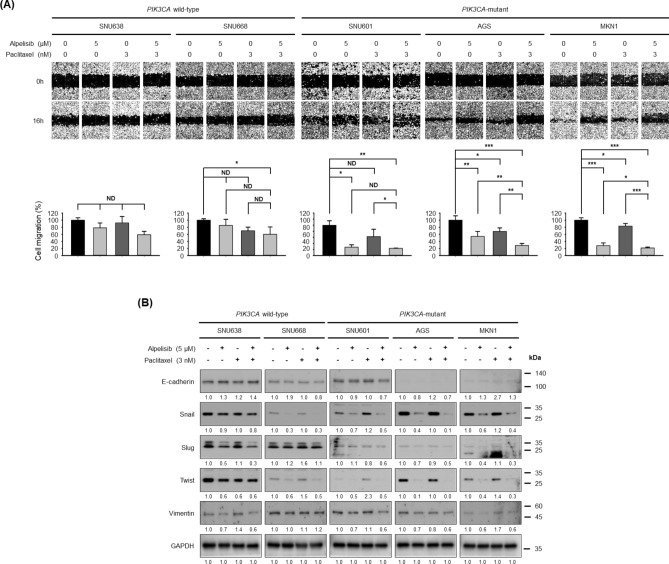
Figure 1Effect of alpelisib on cell proliferation and cell cycle in gastric cancer cells. (A) Alpelisib at indicated concentrations was administered for 72 h to eight gastric cancer cell lines: SNU1, SNU16, SNU484, SNU601, SNU638, SNU668, AGS, and MKN1. All growth inhibition assays were repeated six times. (B) The IC50 values of each cell line were calculated using CalcuSyn software. The Student’s t-test was used to compare two independent groups. *p < 0.05; **p < 0.01; and ***p < 0.001. (C) Cell cycle analysis was conducted through flow cytometry after propidium iodide (PI) staining. Cells (1 × 10⁶) were seeded in 60-mm plates, and then treated with or without 5 μM of alpelisib for 24 h. Data are presented as histograms (bright gray, G0/G1 phase; white, S phase; dark gray, G2/M phase; black, sub-G1). The Student’s t-test was used to compare two independent groups. *p < 0.05; **p < 0.01; and ***p < 0.001.Figure 2Combined effects of alpelisib and paclitaxel on cell proliferation and colony formation in vitro. (A) Five PIK3CA wild-type cells (SNU1, SNU16, SNU484, SNU638, and SNU668) and three PIK3CA-mutant cells (SNU601, AGS, and MKN1) were treated with paclitaxel (0, 0.125 nM, 0.25 nM, 0.5 nM, 1 nM, 2 nM, 4 nM, 8 nM, 10 nM, and 20 nM) for 72 h. The IC50 values were calculated using CalcuSyn software. Data expressed as mean ± standard deviation of three replicates. (B) The eight GC cell lines were exposed to increasing concentration of alpelisib and paclitaxel at a fixed ratio. The synergistic potential of alpelisib combined with paclitaxel was determined by calculating the combination index (CI) using CalcuSyn software according to Chou-Talalay method. The CI values < 1, = 1, and > 1 indicate synergistic, additive, and antagonistic effects, respectively. (C) Colony formation assays were conducted in two PIK3CA wild-type (SNU638 and SNU668) and three PIK3CA-mutant (SNU601, AGS, and MKN1) cells. The Student’s t-test was used to compare two independent groups. *p < 0.05; **p < 0.01; and ***p < 0.001.Figure 3Combined effects of alpelisib and paclitaxel on caspase 3/7 activity, apoptosis, PI3K downstream molecules, PI3K p110α activity, and the expression levels of γ-H2ax in gastric cancer cells. (A) Caspase 3/7 activity (RLU, relative luminescence units) was quantified 24 h after alpelisib, paclitaxel, or their combination treatment in SNU638, SNU668, SNU601, AGS, and MKN1 cells. The Student’s t-test was used to compare two independent groups. *p < 0.05; **p < 0.01; and ***p < 0.001. (B) Apoptosis was evaluated by flow cytometry of Annexin V-propidium iodide (PI) double-stained gastric cancer cells after treatment with alpelisib and/or paclitaxel for 24 h. The Y-axis represents the PI-labeled population, whereas the X-axis represents the Annexin V positive cells. The left lower quadrant (Annexin V-, PI-) indicates normal cells, whereas the right lower quadrant (Annexin V+, PI−) and the right upper quadrant (Annexin V+, PI+) are the early and late apoptotic cells, respectively. The Student’s t-test was used to compare two independent groups. **p < 0.01; and ***p < 0.001. (C) SNU638, SNU668, SNU601, AGS, and MKN1 cells were treated with 5 μM of alpelisib and/or 3 nM of paclitaxel for 30 min. Expression levels of PI3K p110α, p-AKT S473, p-AKT T308, AKT, p-S6K1, S6K1, p-4E-BP1, 4E-BP1, p-GSK3β, GSK3β, p-BAD, and BAD were determined by Western blot. β-actin was the control. Protein expression was analyzed by ImageJ software. (D) The biotinylated-PIP3 (B-PIP3) was set as 100%. The kinase reactions with or without alpelisib or wortmannin were referenced to the B-PIP3 signal to calculate the relative effects of PI3K inhibitors. The recombinant GRP-1 protein was used as the capture protein. GRP-1 bound to the glutathione-coated plate competitively captures either the PIP3 generated by the kinase reaction or the B-PIP3. The Student’s t-test was used to compare two independent groups. *p < 0.05 and **p < 0.01. (E) SNU638, SNU668, SNU601, AGS, and MKN1 cells were treated with 5 μM of alpelisib and/or 3 nM of paclitaxel for 72 h. The expression levels of γ-H2ax was determined by Western blot. Vinculin was the control. Protein expression was analyzed by ImageJ software.Figure 4Combined effects of alpelisib and paclitaxel on cell migration and epithelial–mesenchymal transition markers expression. (A) The migration of SNU638, SNU668, SNU601, AGS, and MKN1 cells was assessed by the wound healing assay after 16 h of treatment. Representative images of the scratched areas are shown. Cell migration was quantified with ImageJ software. The Student’s t-test was used to compare two independent groups. *p < 0.05; **p < 0.01; and ***p < 0.001. (B) SNU638, SNU668, SNU601, AGS, and MKN1 cells were treated with alpelisib combined with paclitaxel for 16 h. Expression levels of E-cadherin, Snail, Slug, Twist, and vimentin were determined by Western blot. GAPDH was the control. Protein expression was analyzed by ImageJ software.Figure 5In vivo anti-tumor activity and tolerability of alpelisib and paclitaxel combination in the MKN1 xenograft model. (A) The survival of mice was analyzed by the Kaplan–Meier method. Five mice were assigned to each treatment group. (B) For 4 weeks of treatment period, the change in body weight was plotted according to the treatment groups. For the in vivo study, the values were presented as the mean ± standard error of the mean. The Student’s t-test was used to compare two independent groups. **p < 0.01. (C) Tumor volumes were measured every week for 4 weeks. The Student’s t-test was used to compare two independent groups. *p < 0.05; **p < 0.01; and ***p < 0.001. (D) The representative images of MKN1 luciferase tumor-bearing mice indicate the size of tumors at 5 weeks. d-luciferin was injected into mice for 10 min and was analyzed using in vivo optical imaging system 200 (IVIS 200). (E) Formalin-fixed paraffin-embedded tumor sections were stained with H&E, Ki-67, and terminal deoxynucleotidyl transferase dUTP nick end labeling (TUNEL) antibodies.
그림 출처: PubMed Central 공개 논문 (PMC7378194)
Conflict of interest statement
The authors declare that they have no conflict of interest.
그 밖의 정보
출판 형태
Journal Article, Research Support, Non-U.S. Gov't
저널
Scientific reports · eISSN 2045-2322
전자 출판
2020-07-23
MeSH
Animals · Antineoplastic Combined Chemotherapy Protocols / pharmacology / therapeutic use · Apoptosis / drug effects · Caspases / metabolism · Cell Cycle / drug effects · Cell Cycle Checkpoints / drug effects · Cell Line, Tumor · Cell Movement / drug effects · Cell Proliferation / drug effects · DNA Damage · Epithelial-Mesenchymal Transition / drug effects · Female · Humans · Mice, Nude · Mutation / genetics · Paclitaxel / pharmacology / therapeutic use · Phosphatidylinositol 3-Kinases / genetics / metabolism · Phosphoinositide-3 Kinase Inhibitors / pharmacology / therapeutic use · Stomach Neoplasms / drug therapy / pathology · Thiazoles / pharmacology / therapeutic use · Xenograft Model Antitumor Assays