Department of Internal Medicine, Seoul National University Hospital, 103 Daehakro, Jongno-gu, Seoul, 03080, Republic of Korea.
Department of Internal Medicine, Korea University Guro Hospital, Seoul, Republic of Korea.
Biomedical Research Institute, Seoul National University Hospital, Seoul, Republic of Korea.
Department of Internal Medicine, Chungbuk National University Hospital, Cheongju, Republic of Korea.
Department of Internal Medicine, Kangwon National University Hospital, Chuncheon, Republic of Korea.
ChunLab, Inc, Seoul, Republic of Korea.
Kidney Research Institute, Seoul National University, Seoul, Republic of Korea.
Department of Internal Medicine, Seoul National University Boramae Hospital, Seoul, Republic of Korea.
Department of Life Science, Multidisciplinary Genome Institute, Hallym University, Chuncheon, Republic of Korea.
Department of Internal Medicine, Seoul National University Hospital, 103 Daehakro, Jongno-gu, Seoul, 03080, Republic of Korea. mdhjlee@gmail.com.
Department of Internal Medicine, Seoul National University College of Medicine, Seoul, Republic of Korea. mdhjlee@gmail.com.
Abstract
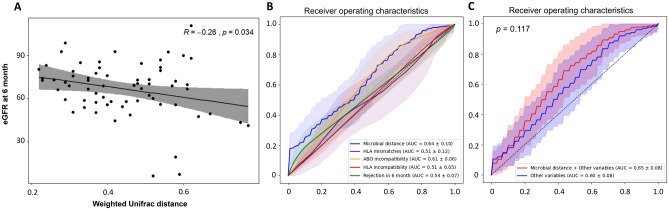
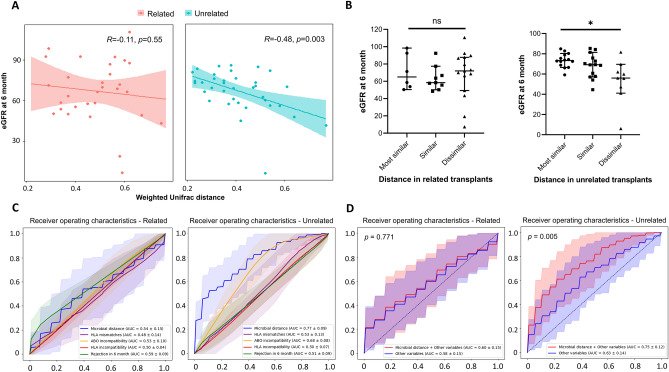
Graft outcomes of unrelated donor kidney transplant are comparable with those of related donor kidney transplant despite their genetic distance. This study aimed to identify whether the similarity of donor-recipient gut microbiota composition affects early transplant outcomes. Stool samples from 67 pairs of kidney transplant recipients and donors were collected. Gut microbiota differences between donors and recipients were determined using weighted UniFrac distance. Among the donor-recipient pairs, 30 (44.8%) pairs were related, while 37 (55.2%) were unrelated. The unrelated pairs, especially spousal pairs, had similar microbial composition, and they more frequently shared their meals than related pairs did. The weighted UniFrac distance showed an inverse correlation with the 6-month allograft function (p = 0.034); the correlation was significant in the unrelated pairs (p = 0.003). In the unrelated pairs, the microbial distance showed an excellent accuracy in predicting the estimated glomerular filtration rate of < 60 mL/min/1.73 m2 at 6-months post-transplantation and was better than human leukocyte antigen incompatibility and rejection. The incidence of infection within 6 months post-transplantation increased in the recipients having dissimilar microbiota with donors compared to the other recipients. Thus, pre-transplantation microbial similarity in unrelated donors and recipients may be associated with 6-month allograft function.
Figures
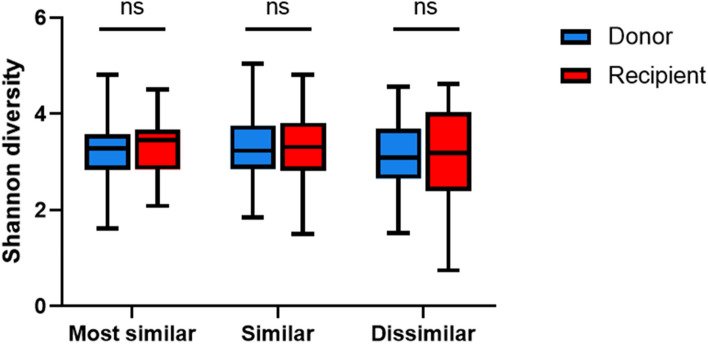
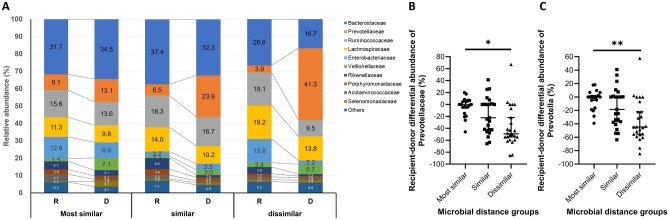
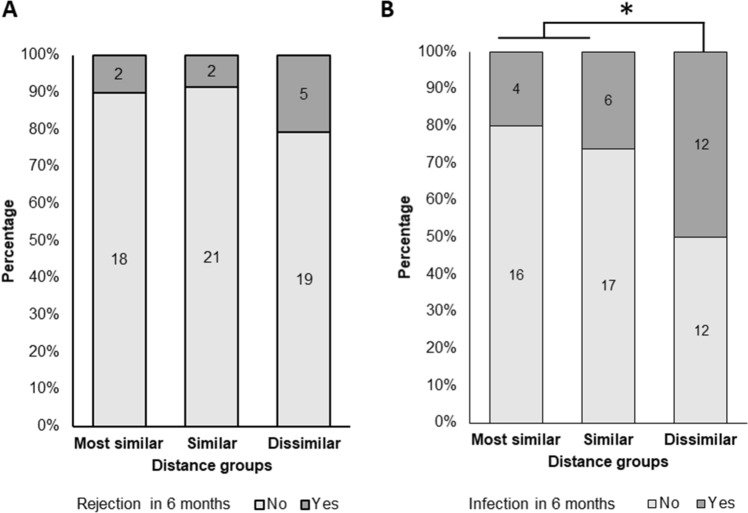
Figure 1Shannon diversities of donors and recipients according to distance groups. Blue bars: donors, red bars: recipients.Figure 2Association of the microbial distance with renal function at 6 months post-transplantation. (A) Linear regression analysis of the correlation between the estimated glomerular filtration rate (eGFR) at 6 months post-transplantation and weighted UniFrac distance of the microbiome. Solid line, regression line; shaded areas, 95% confidence interval. (B) Receiver operating characteristic curves for allograft dysfunction. The colored area represents 95% confidence interval of ROC curves. Blue line, microbial distance; orange line, number of HLA mismatches; red line, HLA incompatibility; green line, rejection in 6 months. (C) Receiver operating characteristic curves for allograft dysfunction according to clinical variables with (red) and without (blue) microbial distance. The colored area represents 95% confidence interval of ROC curves. Red line, microbial distance with clinical variables including recipient’s age, sex, body mass index, hypertension, diabetes, HLA/ABO compatibility, HLA mismatches and donor-recipient relationship; blue line, clinical variables including recipient’s age, sex, body mass index, hypertension, diabetes, HLA/ABO compatibility, HLA mismatches and donor-recipient relationship.Figure 3Difference of association between microbial distance and allograft function after 6-month transplantation according to relationship of donor and recipient. (A) Linear regression analysis of the correlation between the eGFR at 6 months post-transplantation and the weighted UniFrac distance of the microbiome in each subgroup of related and unrelated transplants. Solid line, regression line; shaded areas, 95% confidence interval. (B) Comparison of eGFR at 6 months post-transplantation between the distance groups in related transplants (left) and unrelated transplants (right). ns, not significant; *p < 0.05. (C) Receiver operating characteristic curves for allograft dysfunction in related pairs (left) and unrelated pairs (right). The colored area represents 95% confidence interval of ROC curves. Blue line, microbial distance; orange line, number of HLA mismatches; red line, HLA incompatibility; green line, rejection at 6 months. (D) Receiver operating characteristic curves for allograft dysfunction in related (left) and unrelated pairs (right) according to clinical variables with (red) and without (blue) microbial distance. The colored area represents 95% confidence interval of ROC curves. Red line, microbial distance with clinical variables including recipient’s age, sex, body mass index, hypertension, diabetes, HLA/ABO compatibility, HLA mismatches and donor-recipient relationship; blue line, clinical variables including recipient’s age, sex, body mass index, hypertension, diabetes, HLA/ABO compatibility, HLA mismatches, and donor-recipient relationship.Figure 4Differential abundance of microbiota between donor and recipient according to distance groups. (A) Relative abundance of major families between donor and recipient. (B) Comparison of differential abundance of family Prevotellaceae in three distance groups. *, q < 0.05. (C) Comparison of differential abundance of genus Prevotella in three distance groups. **, q < 0.01.Figure 5Incidence of rejection (A) and infection (B) within 6 months after transplantation according to the distance groups. *p < 0.05.
그림 출처: PubMed Central 공개 논문 (PMC7641223)
Conflict of interest statement
The authors declare no competing interests.
그 밖의 정보
출판 형태
Comparative Study, Journal Article, Research Support, Non-U.S. Gov't